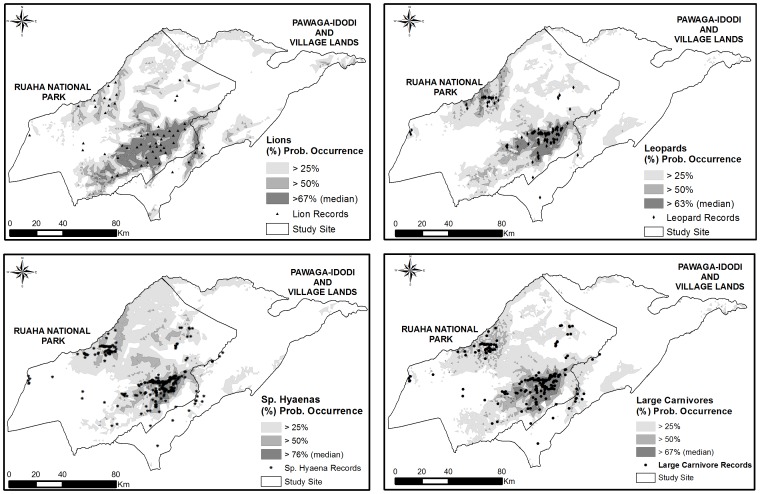
Figure 3. Predictive map of the potential distribution of large carnivores in Tanzania's Ruaha Landscape.
Map of potential distribution of large carnivores across Tanzania's Ruaha landscape. The maps were generated using ensemble modelling approach based on the outputs of Maxent, ENFA and SVMs. The colour gradient indicates probability of species occurrence, with darker areas representing the highly suitable areas (h.s.> species median suitability) for species occurrence.

