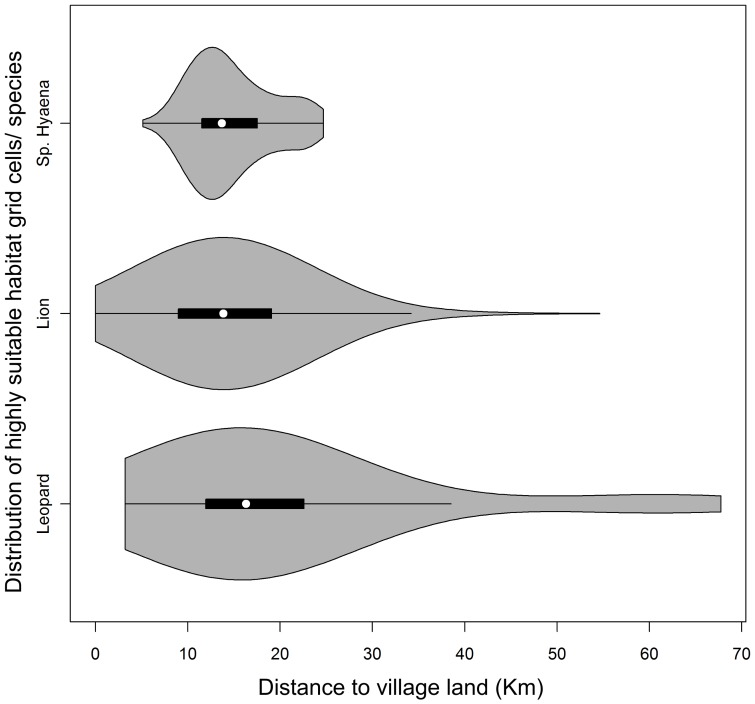
Figure 4. Distribution of highly-suitable areas for large carnivores in relation to proximity to village lands.
Distribution of grid cells deemed highly suitable for large carnivores in relation to proximity to village land. The grey areas represent the probability density of the data. The horizontal black bar represents the first-to-third interquartile range, and the horizontal black line represents the 1.5 times the interquartile range. The median is represented by the white dot.

