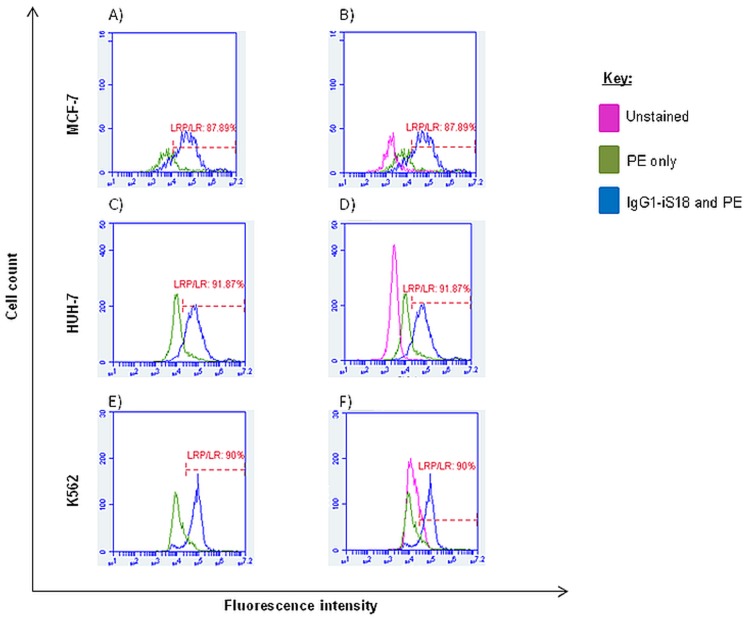
Figure 2. Quantification of liver cancer (HUH-7) and leukaemia (K562) cells within a population which exhibit LRP/LR on their cell surface.
The first peak in graphs A, C and E is representative of non-labelled cells i.e. cells labelled with goat anti-human PE-coupled secondary antibody only, whereas the second peak is indicative of cells labelled with both anti-LRP/LR specific antibody IgG1-iS18 and the secondary antibody, both at a concentration of 30 µg/ml. Graphs B, D and F depict the inclusion of an unstained control to show no non-specific secondary antibody binding. Experiments were carried out in triplicate and repeated at least three times with 20 000 cells being counted per sample.

