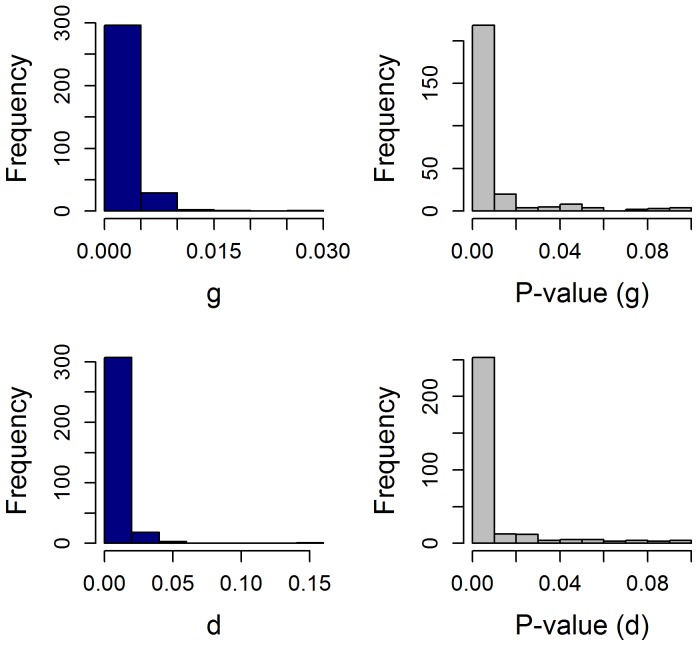
Figure 1. Histograms depicting the distributions of the g and d values and the corresponding regressor p-values.
While a p value of <0.1 was accepted as valid in this analysis, in fact as can be seen, the overwhelming number of p-values were much lower than that, an indication of the validity of the fits [median g = 0.00084; median p-value for g = 0.000047; median d = 0.0050; median p-value for d = 0.00024]. Note the expected higher value for median d compared to median g. See also File S1.

