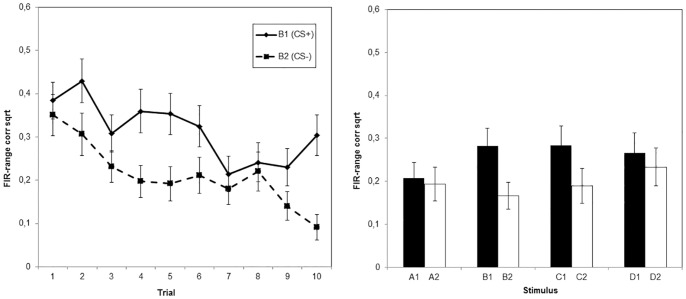
Figure 4. Mean skin conductance responses over the acquisition phase and generalization of acquisition test.
Responses were range-corrected and square-root transformed. The left panel represents the data from the acquisition phase, per trial, for both the CS+ (B1) and the CS− (B2). The right panel shows the data from the generalization of acquisition test of all stimuli from both categories. Each stimulus was presented once during this phase.

