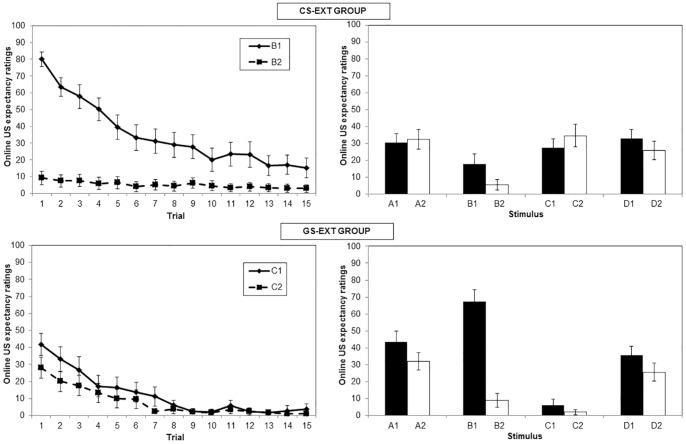
Figure 5. Mean expectancy ratings over the extinction phase and generalization of extinction test.
Ratings were registered at the moment the stimulus and expectancy scale disappeared from the screen. Higher levels indicate more certainty about shock (100 = “Certainly a shock”), lower levels indicate more certainty about absence of shock (0 = “Certainly no shock”). The upper graph shows the data of CS-ext group, the lower graph the data of GS-ext group. The left panel represents the data from the extinction phase, per trial, for both B1 and B2 (group CS-ext) or C1 and C2 (group GS-ext). The right panel shows the data from the generalization of extinction test of all stimuli from both categories. Each stimulus was presented once during this phase.

