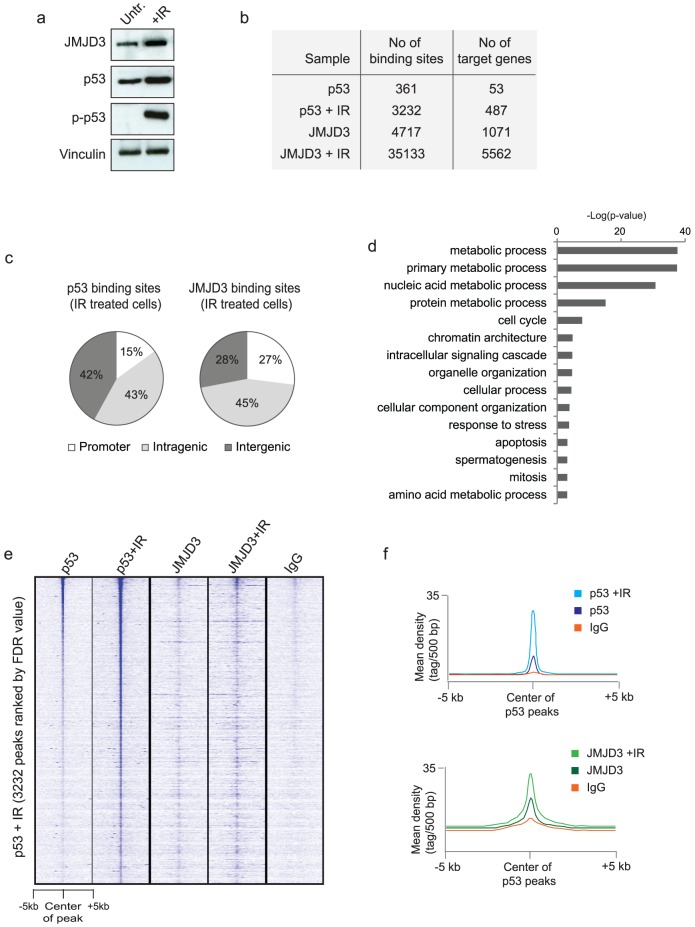
Figure 2. Genome-wide binding of JMJD3 and p53 before and after IR treatment.
a, Western blot of JMJD3, p53, p-p53 (p53 serine 15 phosphorylation) and vinculin in human immortalized BJ fibroblasts either untreated or 6 hours after exposure to IR. b, The number of identified binding sites and target genes for p53 and JMJD3 (defined as binding of p53 or JMJD3 +/− 5 kb from TSS) in untreated or IR exposed cells. c, The distribution of identified p53 peaks (left panel) or JMJD3 peaks (right panel) in IR treated cells into promoter regions (+/−5 kb from TSS), intragenic regions or intergenic regions (> 5 kb from a gene). d, Gene Ontology analysis of JMJD3 target genes in IR treated BJ cells. e, Heat map of p53 and JMJD3 ChIP-seq data from untreated or radiated cell representing the 3232 identified p53 binding sites. The heat map is ranked according to the FDR-value of the p53 peaks. f, The average distribution of p53, JMJD3 and IgG across the centre of all p53 peaks before and after IR.

