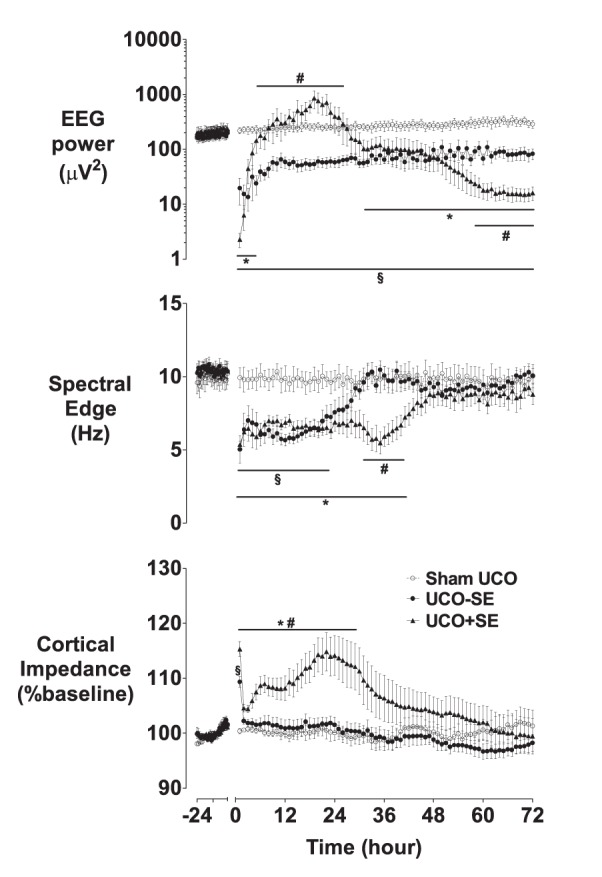
Figure 2. EEG power, spectral edge, and cortical impedance, during 24 h baseline and for 72 h recovery after UCO.

Occlusion data omitted. *p<0.05 UCO with status epilepticus vs. sham UCO; #p<0.05 UCO with status epilepticus vs. UCO without status epilepticus; §p<0.05 UCO without status epilepticus vs. sham UCO. Data are mean±SEM.
