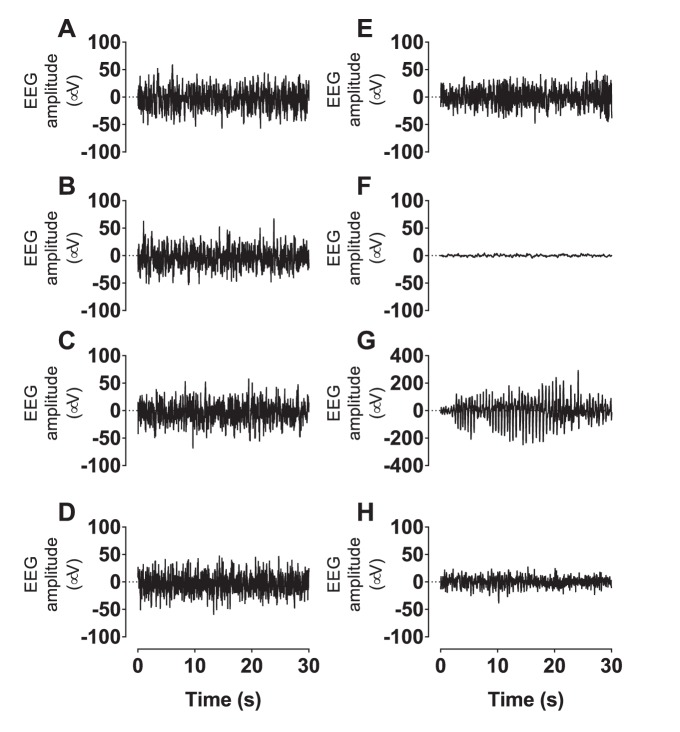
Figure 4. Representative 30(A, E), 30 min after UCO or sham UCO showing marked EEG suppression after occlusion (B, F), during the seizure period, showing an example of an evolving seizure (C, G), and during day 3 of recovery (D, H).
Sham UCO example (A–D); UCO example (E–H). Data are continuous EEG recordings saved at 64 Hz.

