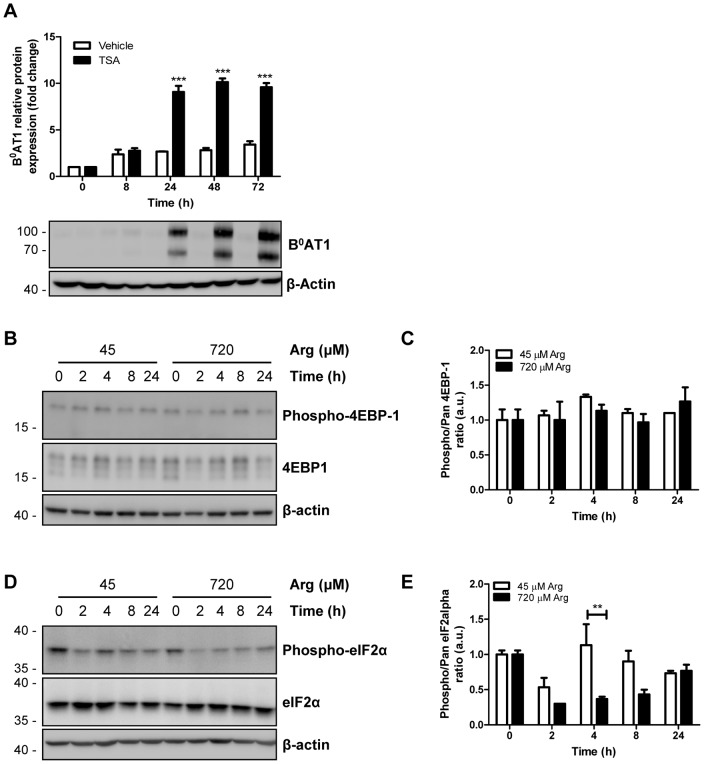
Figure 7. Effect of arginine on cell signaling.
A: Mycoplasma-infected B0AT1-TMEM27 overexpressing MDCK cells were grown in standard cell culture medium supplemented with an inhibitor of histone deacetylation (TSA, 1 µM) for the indicated times. B0AT1 expression was analyzed by Western blotting and intensity of the immunoreactive bands was quantified, standardized to β-actin and normalized to time 0. Representative Western blotting images are shown. Data are represented as mean ± SEM (n = 3). Groups were compared by two-way ANOVA followed by Bonferroni post-test; *** p≤0.001. B–E: Mycoplasma-infected B0AT1-TMEM27 overexpressing MDCK cells were incubated with 45 or 720 µM arginine medium for the indicated times and the whole cell protein extracts were subjected to immunoblotting for total- and phospho-4EBP-1 (B–C) and eIF2α (D–E). Representative Western blotting images are shown in B and D. The degree of 4EBP-1 (C) and eIF2α (E) phosphorylation was assessed by quantifying the immunoreactive bands of the phosphorylated form and normalizing to the total protein in each lane. Data are represented as mean ± SEM (n = 3). Groups were compared by one-way ANOVA followed by Dunnett post-test; ** p≤0.01.

