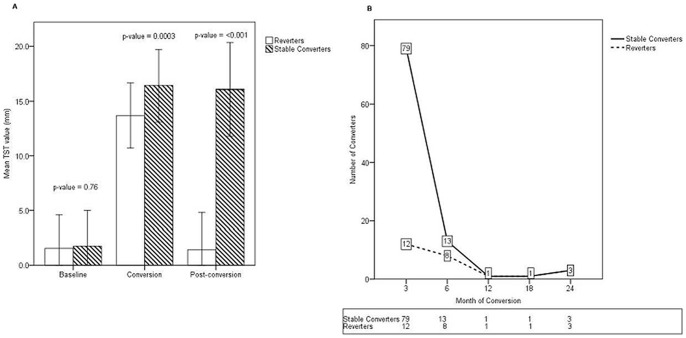
Figure 1. Longitudinal TST measurements among HHC.
TST were placed at study enrollment and every 3-month course of INH preventive therapy and post-conversion TST was placed 12 months following each subject's initial conversion event. Following measurement of post-conversion TST, subjects were classified as either stable converters or reverters. Shown are mean TST measurements (mm) ± 1 SD for all eligible study participants at study enrollment (baseline), conversion, and post-conversion time points (A). As shown in Panel B (numbers in boxes indicate number of conversions per time point), subjects with stable conversions were more likely to experience their initial conversion soon following study entry (mean time to conversion, 4.1 months) while reverters experienced their initial conversion later (mean time to conversion 7.2 months; p = 0.03).

