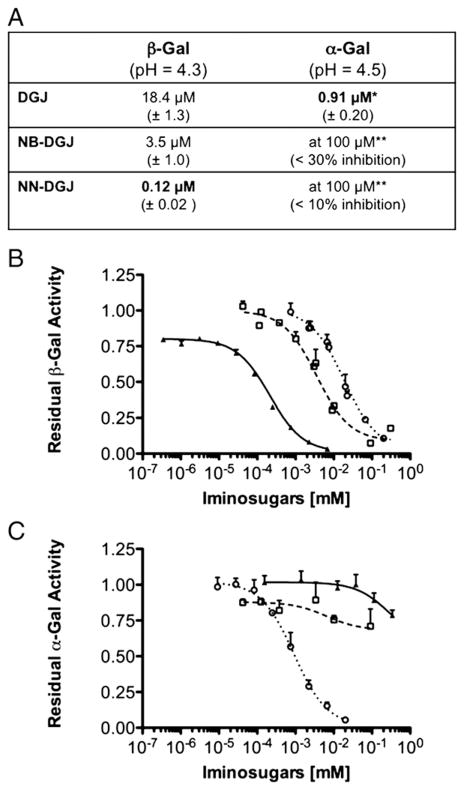
Fig. 1.
IC50 curves of DGJ and two N-alkyl derivatives for human α-Gal and β-Gal. A: The IC50 values of DGJ, NB-DGJ and NN-DGJ (±SD) were calculated by non linear regression analysis from the data points in the graphs shown in B and C for β-Gal and α-Gal enzymes, at their pH optima. *DGJ is in phase III clinical trial as a PC for the treatment of Fabry disease; **The inhibition measured was too weak to allow for the calculation of an IC50. B: Serial dilutions of DGJ (open circle), NB-DGJ (open square) and NN-DGJ (black triangle) were incubated in presence of fixed amounts of an enriched fraction of β-Gal. The relative enzyme activity determined in the presence of each of the inhibitor concentrations tested (N=4) was calculated relative to the enzyme activity measured in the absence of that inhibitor (N=4) and plotted on the Y axis, versus the [inhibitor] (mM) plotted on a logarithmic scale on the X axis. Data are expressed as mean+SD. C: Serial dilutions of DGJ, NB-DGJ and NN-DGJ were incubated in presence of fixed amounts of an enriched fraction of α-Gal. The same experimental protocol and data analysis as described in B was followed, except α-Gal enzyme activity was measured.

