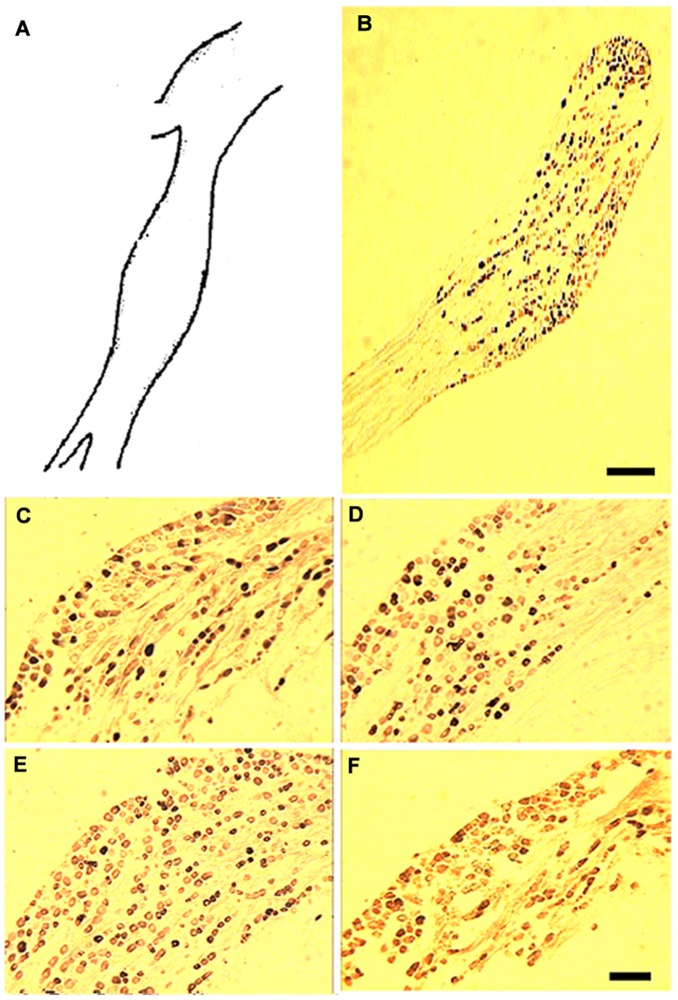
Figure 1. Distribution and expression of P2X1–4 subunits in NG tissue.
(A) A schematic diagram of the maximum cross section of a rat nodose ganglion (A, corresponding to panel B). (B) Representative graph of the distribution of P2X receptor-positive cells throughout the whole nodose ganglion section under a 20× light microscopic field. (C–F) Immunohistochemical staining using polyclonal antibodies against P2X1 (C), P2X2 (D), P2X3 (E), and P2X4 (F); 100× magnification. Scale bars in B = 500 µm and F = 100 µm.

