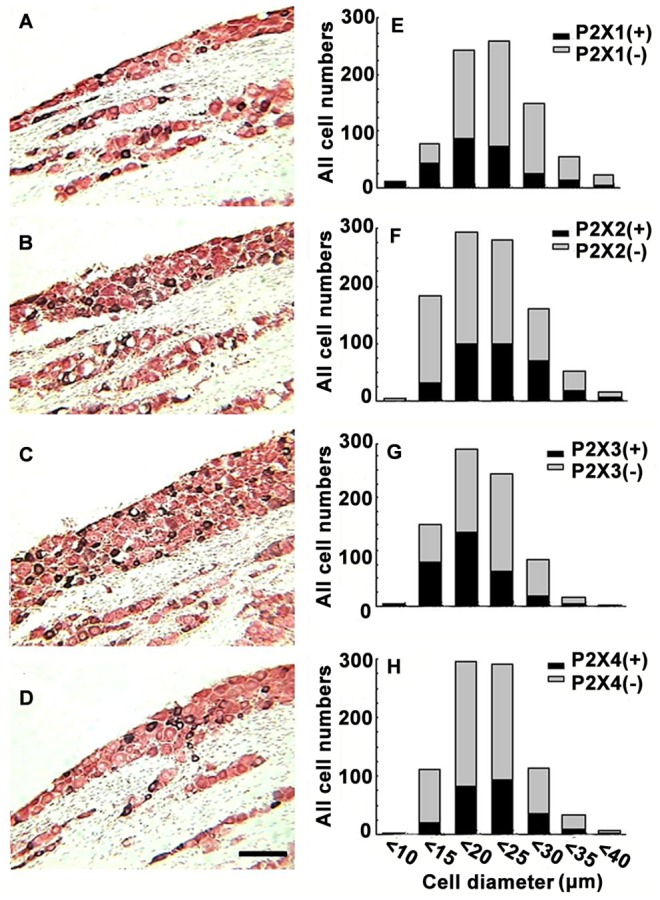
Figure 2. The frequency distribution of the area-size of P2X1–4 subunit-positive neurons.

(A), (B), (C), and (D) show P2X–IR sections that were counterstained with neutral red to precisely calculate the number of P2X1, P2X2, P2X3, and P2X4-positive neurons, respectively (using black positive cells compared with red negative cells). Scale bar in (D) = 100 µm. (E), (F), (G), and (H) represent the frequency distribution of the area-size of P2X1, P2X2, P2X3, and P2X4-IR, respectively.
