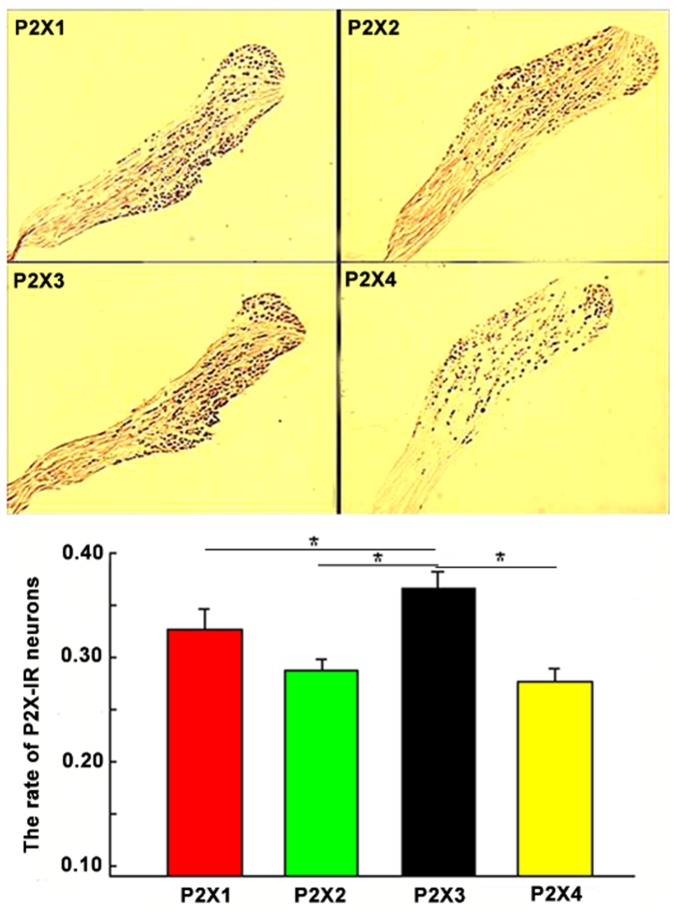
Figure 3. The proportion of P2X1–4 subunit-expressing neurons compared with the total number of NG neurons.
The upper panel shows immunohistochemical staining for P2X1–4 subunits in the maximum cross section of the NG tissues. The lower panel shows that P2X3-IR was the most prevalent neuronal subtype, following by P2X2-IR; P2X4-IR had the lowest prevalence. *p<0.05.

