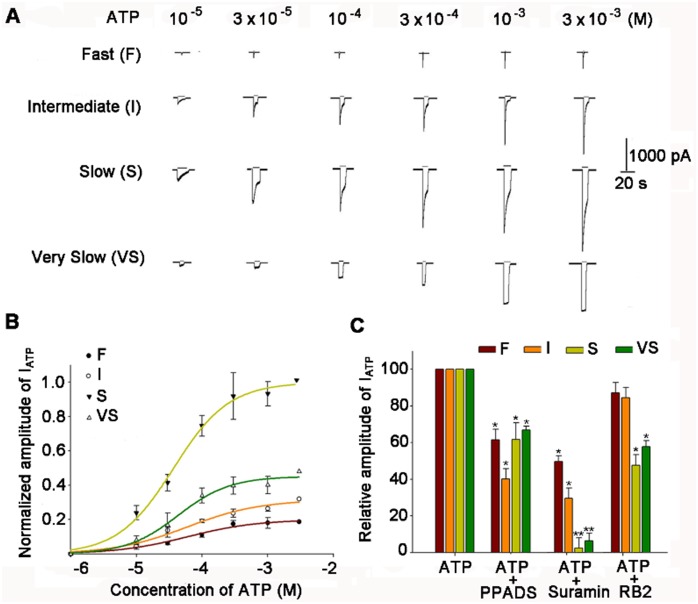
Figure 7. Concentration-response relationships and the efficacy order of P2X receptor antagonists on IATPs.
(A) Sequential current traces of F, I, S, and VS ATP-activated currents recorded from rat NG neurons in response to different concentrations of ATP (from 10−5 to 3×10⁻³ M). Current traces of each type were obtained from the same neuron. (B) The dose-response curves for each type of IATPs. Each point represents the means ± SEM of 10–15 neurons. All ATP-induced currents were normalized to the response induced by 3×10⁻³ M ATP in each type. The holding potential was set at −60 mV. The data for ATP were a good fit to the Hill equation I = Imax/[1+ (EC50/C) n], where C is the concentration of ATP, I is the normalized amplitude of IATP, and EC50 is the concentration of ATP for the half maximal current response. (C) The efficacy order of the inhibitory effects of P2X receptor antagonists on four distinct IATPs. The columns in the bar graph show the inhibitory effects of the P2X receptor antagonists: PPADS (10−4M), suramin (10−4 M), and RB2 (10−4 M). F-type, suramin >PPADS > RB2; I-type, suramin > PPADS > RB2; S-type, suramin > RB2> PPADS; VS-type: suramin > RB2> PPADS. *p<0.05, **p<0.01.

