
Figure 3. Testing of ABs to keratin and p62 in mouse liver cells after DDC treatment.
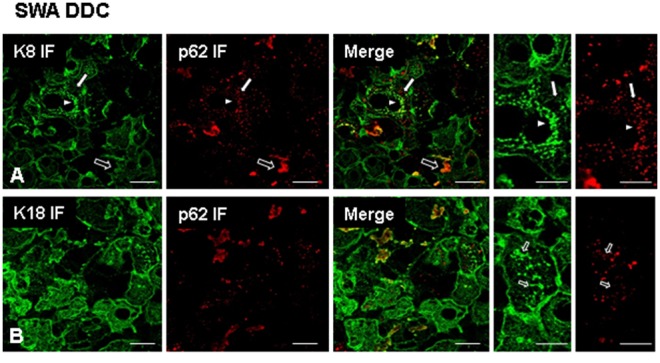
Immunofluorescence stain on SWA mouse livers after 12 weeks DDC treatment using ABs to K8 (green), p62 (red) (A), and K18 (green), p62 (red) ABs (B). For image (A), note the presence of small (arrowhead) and large (empty arrow) MDBs. Additionally, small granules positive for p62 only can be observed (arrow). For image (B), note that small MDB-like keratin aggregates can be observed that are negative for p62 (empty arrow). Scale bars: 20 µm.