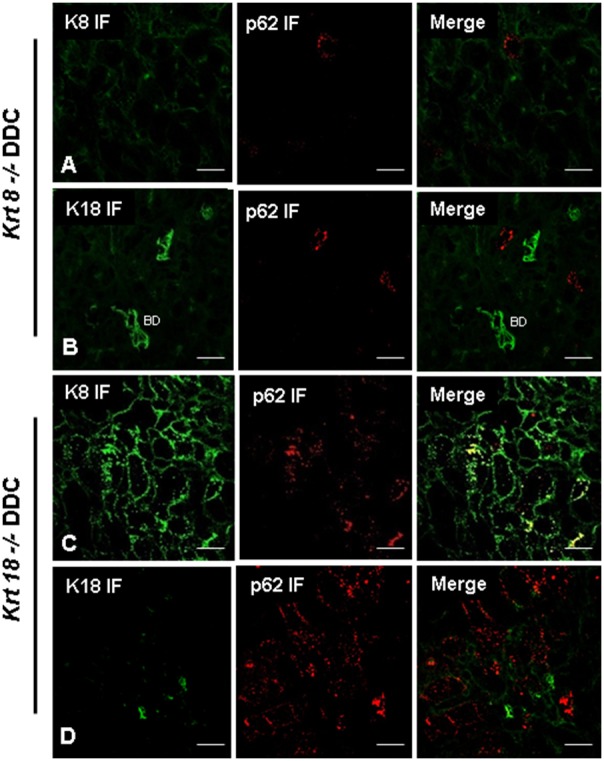
Figure 5. Demonstration of keratin and p62 in DDC treated krt8−/− and krt18−/− mice.

IF staining on krt8−/− (A, B) and krt18−/− (C, D) mouse livers after 12 weeks DDC treatment. Images (A) and (C) show the localization of K8 (green) and p62 (red). Images (B) and (D) show the localization of K18 (red) and p62 (red). A positive colocalization of p62 and K8 in krt18−/− mice was observed, which indicates presence of MDBs. In contrast krt8−/− mice did not develop MDBs after DDC feeding, therefore neither K18 nor p62 accumulated. ABs to K18 show positivity in bile ducts (BD) in krt8−/− mice (B). The green reaction in image (D) relates to plasma cells. Scale bars: 20 µm.
