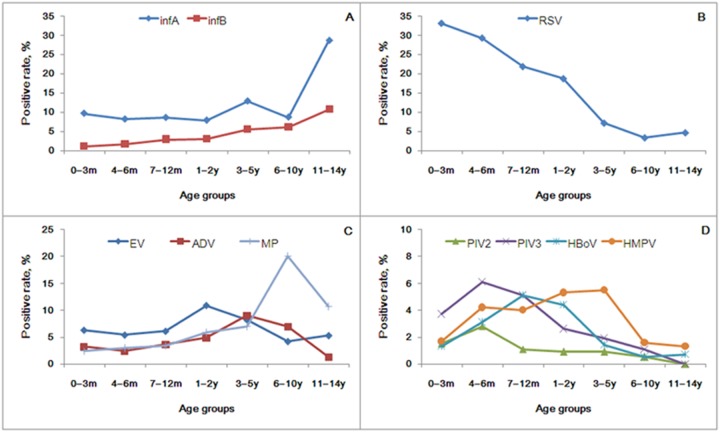
Figure 2. The patterns of pathogen distribution among different pediatric age groups in 4242 pediatric patients with ARI in Guangzhou from July 2009 to June 2012.
229E: human coronavirus 229E, OC43: human coronavirus OC43, NL63: human coronavirus NL63, HKU1: human coronavirus HKU1. A: Detection rates increased as age increased (p<0.001); B: Detection rates declined as age increased (p<0.001); C and D: Detection rate peak occurred as age increased (p≤0.009).

