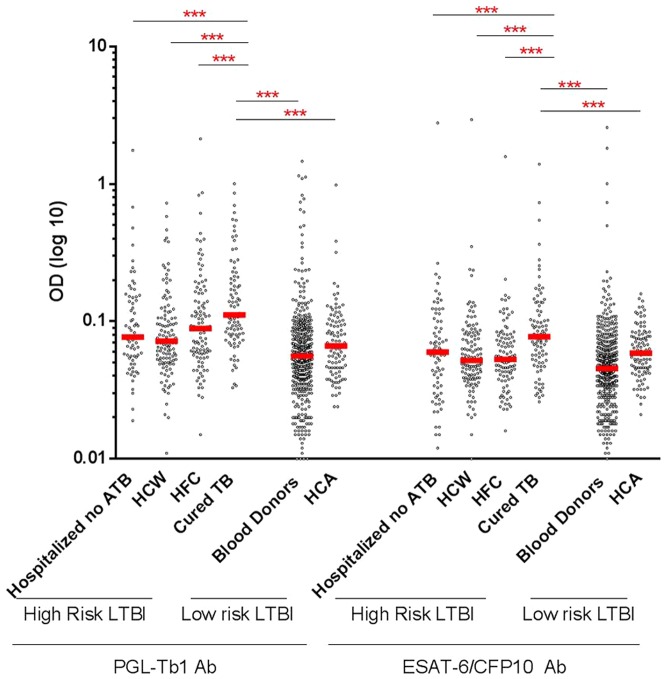
Figure 4. Individual IgG antibody levels against PGL-Tb1 and ESAT-6/CFP10 in subjects without active tuberculosis disease stratified by the risk of tuberculosis infection.
Dot plot indicates the single antibody level per subject analyzed; median is indicated by the red line. ***: p<0.0001. Footnotes: LTBI: latent tuberculosis infection; Ab: antibody; ATB: active tuberculosis; HCW: health care workers; HFC: healthy family contacts; HCA: healthy community adults; OD: optical density.

