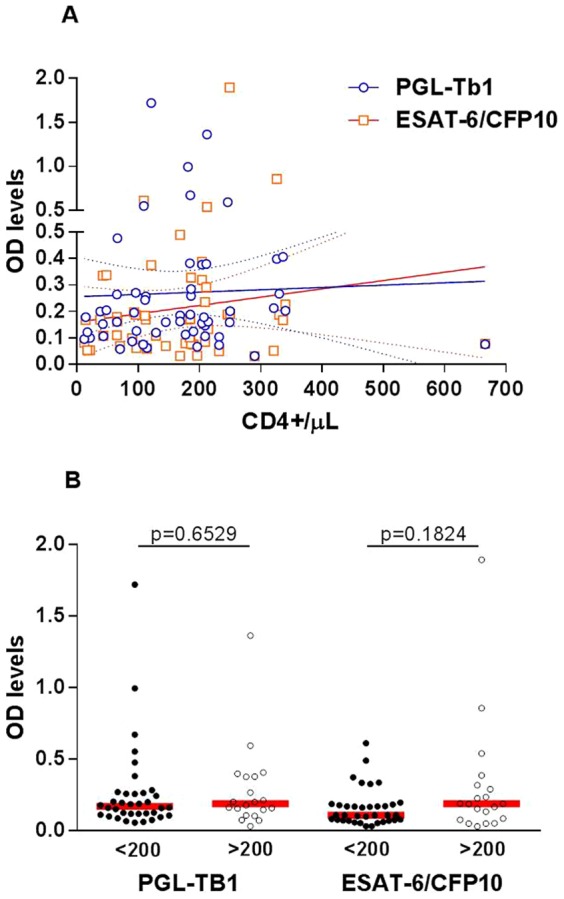
Figure 7. Impact of CD4 counts on antibody responses in HIV-infected active tuberculosis patients.

A. Correlation between individual CD4 cell counts and individual serological tests based on optical density values of ELISA against PGL-Tb1 antigen (blue spot) (R2 = 0.00103; p = 0.8141) or ESAT-6/CFP10 antigen (red spot) (R2 = 0.01574; p = 0.3569) in 53 HIV-infected ATB patients. The continuous lines represent the linear regression curve for anti-PGL-Tb1 antibody or for anti-ESAT-6/CFP10 antibody tested individuals; the hatched lines represent the 95% confidence intervals. B. Anti-PGL-Tb1 and anti-ESAT-6/CFP10 antibody levels stratified by CD4 cell counts among the 56 HIV-infected ATB patients. Horizontal red lines indicate the median value. Footnotes: OD: optical density.
