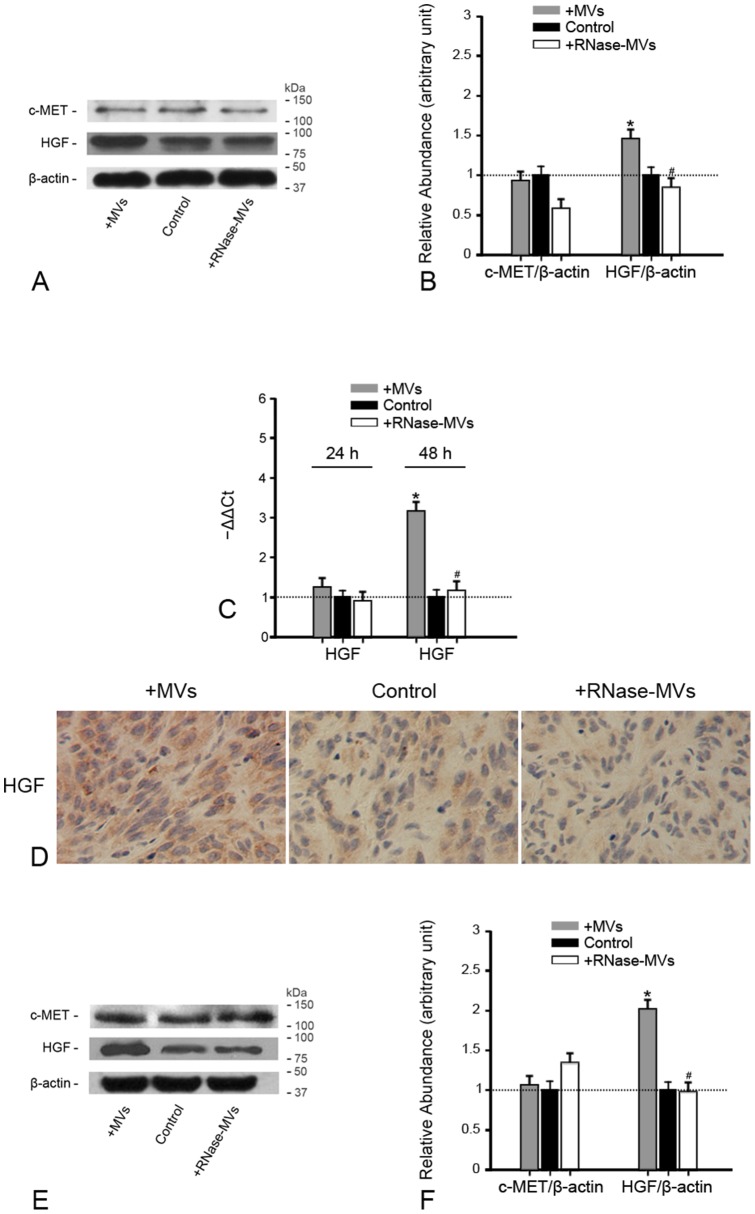
Figure 5. MVs induce HGF expression in RCC either in vivo or in vitro.
(A)(B) Gel photograph and densitometric analysis of HGF and c-MET protein expression in 786-0 cells. At 48 h following the addition of MVs, HGF protein expression in 786-0 cells was prominently up-regulated while c-MET expression underwent no significant change. Pre-treatment with RNase destructed the effect of MVs. The density of each band was determined. Values in the graph are expressed as densitometry ratios of HGF/β-actin or c-MET/β-actin as folds over control (dotted line). *P<0.05, MVs vs. control; # P<0.05, RNase-MVs vs. MVs; (C) HGF gene expression in 786-0 cells. After 48 h of incubation with 786-0 cells, MVs substantially induced the up-regulation of HGF gene expression, frustrated by RNase treatment. The Ct (threshold cycle) for each gene was determined for each sample. The quantification of HGF was normalized by β-actin. HGF expression in control group was regarded as the calibrator (dotted line). The relative expression of the target gene was calculated by 2−ΔΔCt. *P<0.05, MVs vs. control; # P<0.05, RNase-MVs vs. MVs; (D) HGF staining on tumor sections. There was a significant intensification of HGF staining on tumor sections in the setting of MVs as compared to RNase-MVs or control; (E)(F) Gel photograph and densitometric analysis of HGF and c-MET protein expression in tumor tissues. MVs greatly induced HGF protein expression in tumor tissues. As in vitro, pretreatment with RNase abrogated the inductive effect. *P<0.05, MVs vs. control; # P<0.05, RNase-MVs vs. MVs.

