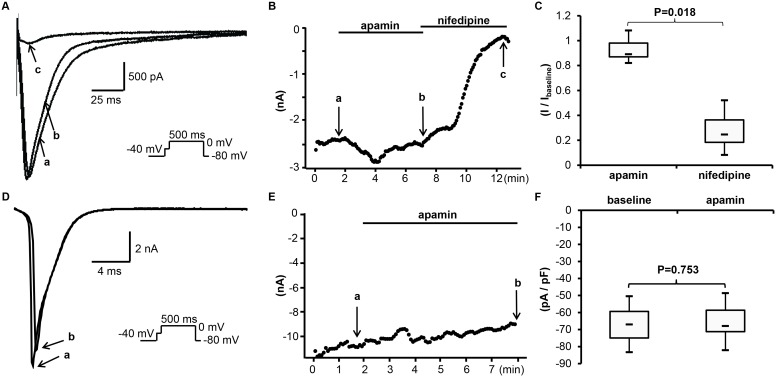
Figure 7. Effects of apamin on I Ca and I Na in rabbit cardiomyocytes.
(A) The representative I Ca tracings obtained by a pulse protocol shown in the inset before apamin (a), after apamin (b) and after nifedipine (c) at time points indicated by arrows a through c, respectively, in (B). (B) The time course of peak I Ca measured at 0 mV. (C) The summary of drug effects normalized to baseline. (D) The representative tracings of I Na obtained by a pulse protocol shown in the inset before apamin (a), after apamin (b) at time points indicated by arrows a and b, respectively, in (E). (E) The time course of peak I Na at –40 mV. (F) The summary of current densities before and after apamin.

