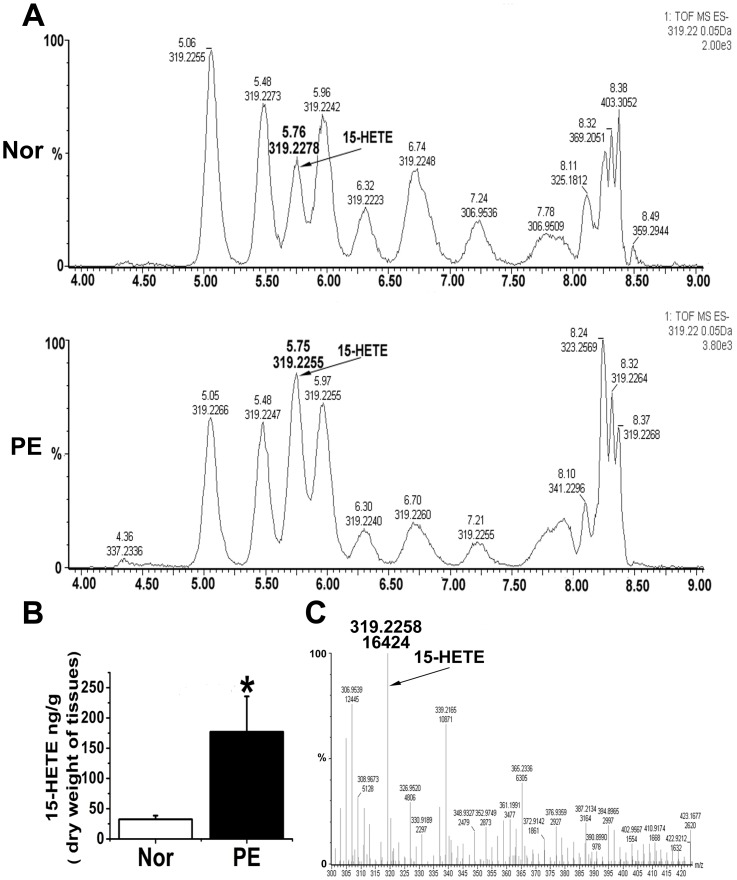
Figure 3. Identification and measurement of endogenous 15-HETE levels using HPLC-MS.
A. Typical HPLC-MS chromatograms. B. 15-HETE content in preeclamptic placenta and normal tissue (n = 10). PE: preeclampsia; Normal: normal pregnancies; *, P = 0.03326, PE compared with Normal. C. Identification of 15-HETE using trap mass spectrometry. The arrow points to the 15-HETE peak in the chromatograms.

