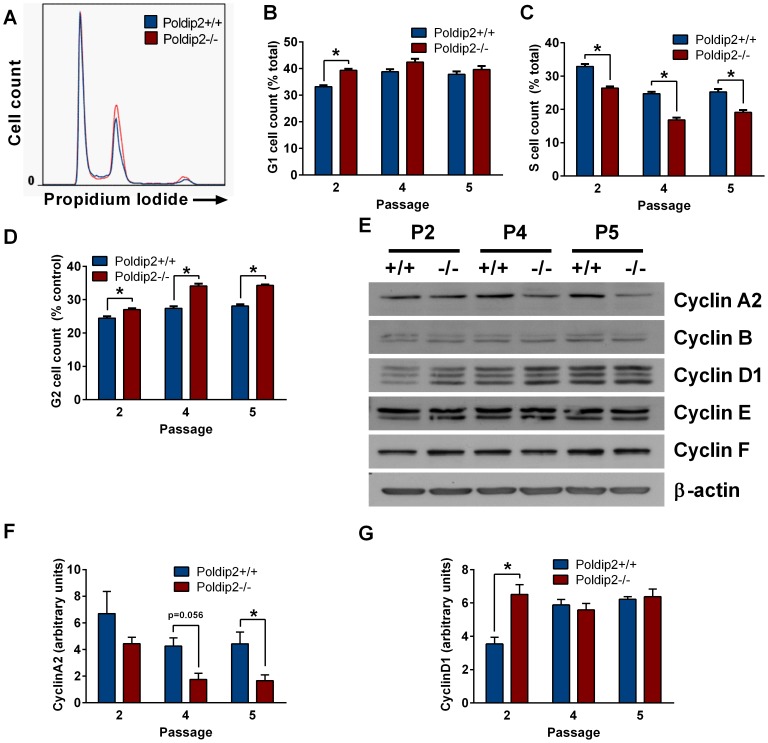
Figure 4. Poldip2−/− MEFs exhibit altered cell cycle characteristics.
Asynchronous MEFs were collected at passage 2, 4 and 5 and stained with propidium iodide for FACS analysis of the cell cycle. (A) Passage 4 data is shown as an example histogram of DNA content as measured by flow cytometry and fit to the Dean-Jett-Fox model to calculate the percentage of cells in (B) G1, (C) S and (D) G2/M. (E) Key cell cycle protein expression was measured by immunoblotting. Protein levels were quantified by densitometry and corrected to β-actin expression for (F) CyclinA2 and (G) CyclinD1. All three bands were used in the quantification of CyclinD1. Error bars represent mean ± SEM of 3–4 independent experiments. * P<0.05 comparing Poldip2+/+ with Poldip2−/−.

