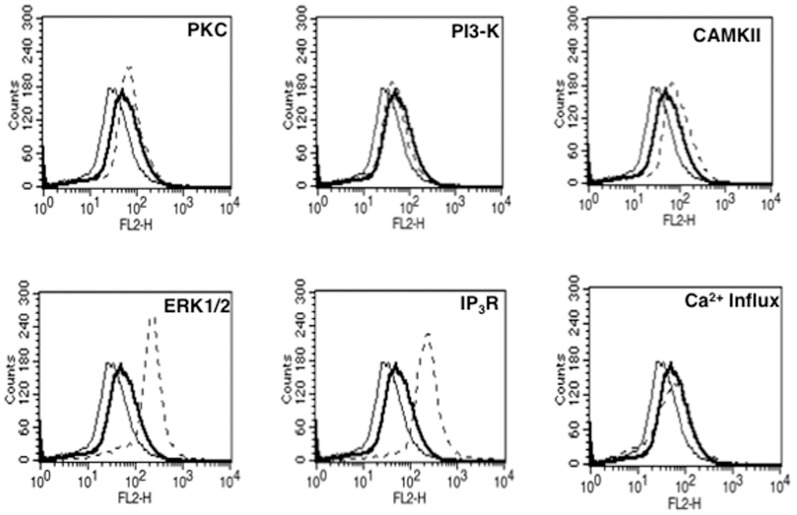
Figure 3. PKC, ERK/MAPK, CAMKII and intracellular calcium release negatively regulate Rv3416 mediated VGCC expression.
PMA stimulated THP1 cells were incubated with inhibitors to indicated molecules (see Experimental Procedures) for 1h prior to stimulation with Rv3416. L-type VGCC levels were monitored by FACS 72h post stimulation. Bold lines represent cells stimulated with 30 µg/ml of Rv3416, while dotted lines represent cells incubated with inhibitors to indicated molecules followed by stimulations with Rv3416. Thin lines represent unstimulated cells. One of four independent experiments is shown.

