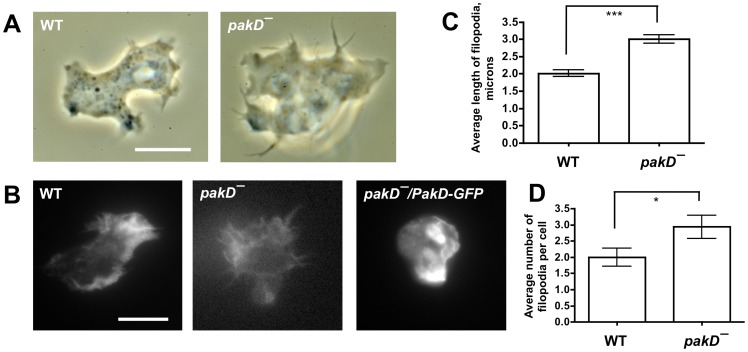
Figure 7. pakD– cells show enlarged filopodia.
(A) Live vegetative cells in submerged culture were imaged using an inverted microscope with a 60× objective. Bar is 10 µm. (B) Cells were grown in chamber slides in HL5 media overnight and were then fixed and stained with Alexa Fluor 594 phalloidin. Expression of PakD-GFP in the shown pakD–/act15::PakD-GFP cell was confirmed by the presence of a punctum PakD-GFP signal (data not shown). Bar is 10 µm. (C) The filopodium length was measured for all filopodia on at least 30 cells per condition. “***” indicates p<0.001 (t-test). (D) The average number of filopodia per cell visible in a single focal plane was measured by counting filopodia on at least 30 cells per condition. “*” indicates p<0.05 (t-test).

