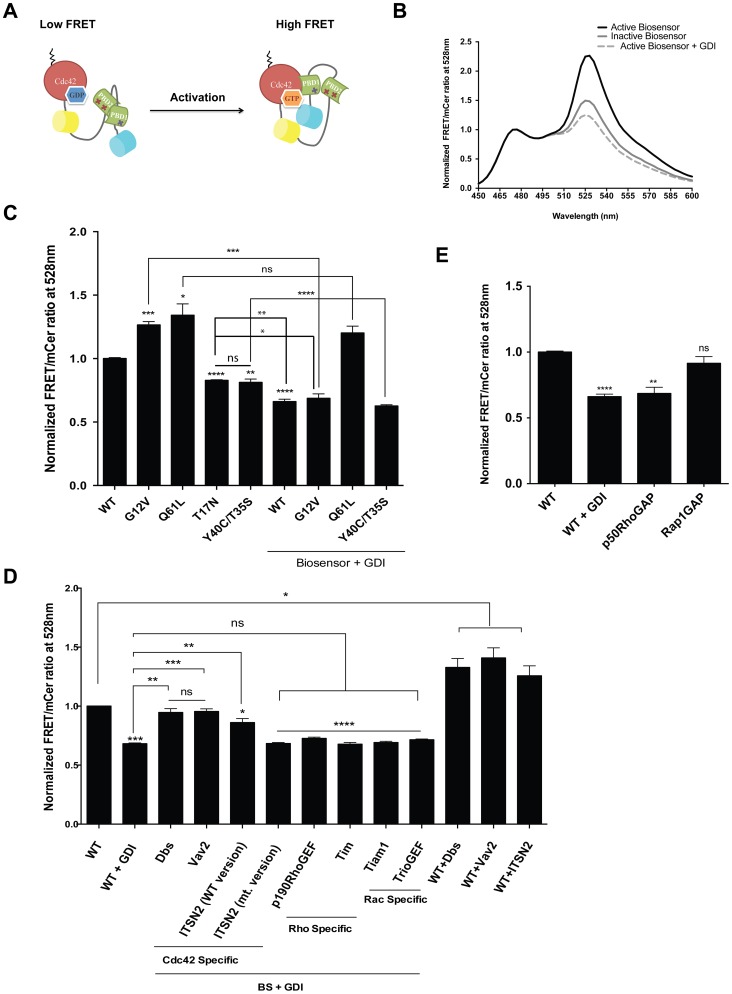
Figure 1. Cdc42 biosensor design and characterization.
A) Diagram illustrating the design of the single-chain Cdc42 biosensor. H83D mutation is indicated in the first PBD domain. In the second PBD domain, both H83D and H86D mutations are indicated by Xs. B) Normalized fluorescence excitation and emission spectra show a 1.53 fold difference between the constitutively active versus the dominant negative (not bound to GDI) versions of the Cdc42 biosensor. C) Normalized FRET/mCer ratios of wild-type (WT) and mutant forms of the Cdc42 biosensor with or without co-expression with negative regulator (GDI). D) and E) Normalized FRET/mCer ratios of wild-type biosensor co-expressed with upstream Cdc42 targeting and non-specific regulators (GEFs) (D) and negative regulators (GAPs) (E). Data in all cases are normalized to FRET/mCer ratio of wild-type biosensor alone. Data are the mean −/+ SEM of 3 different experiments. * p< 0.017, ** p<0.002, ***p<0.0006, ****p<0.0001, ns: non-significant. Significance designations on top of bars are compared to the wild-type biosensor expression alone. All other significance comparisons are specifically indicated.

