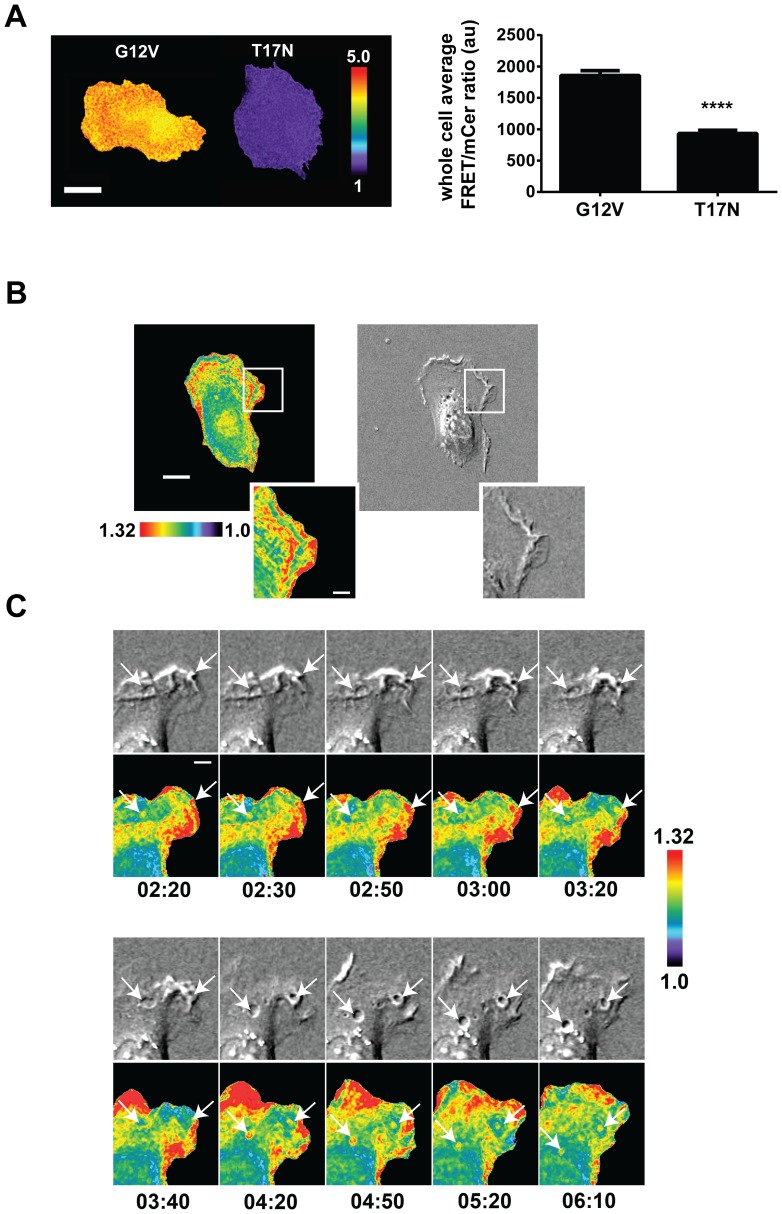
Figure 2. Cdc42 biosensor in mouse embryonic fibroblasts.
A) A constitutively active (G12V) versus the dominant negative (T17N) versions of the Cdc42 biosensor was transiently overexpressed in MEFs, fixed, and imaged to calculate the whole-cell average ratio values. Scale bar = 20 µm. Quantification is also shown, n = 15 cells each, error limits are SEM, **** p<0.0001 using the student-t test. B) Representative still-frame of Cdc42 activation patterns at the edges of MEFs during random protrusion/retraction. The white bar in the whole-cell frame corresponds to 15µm, in the zoomed insets, 5µm. C) Zoomed panels of the timelapse of macropinocytosis are shown. White arrows point to the regions of interest, the bar indicates 5µm. Images shown are from widefield microscopy thus at the macropinosome, projections from multiple membrane layers are visible.

