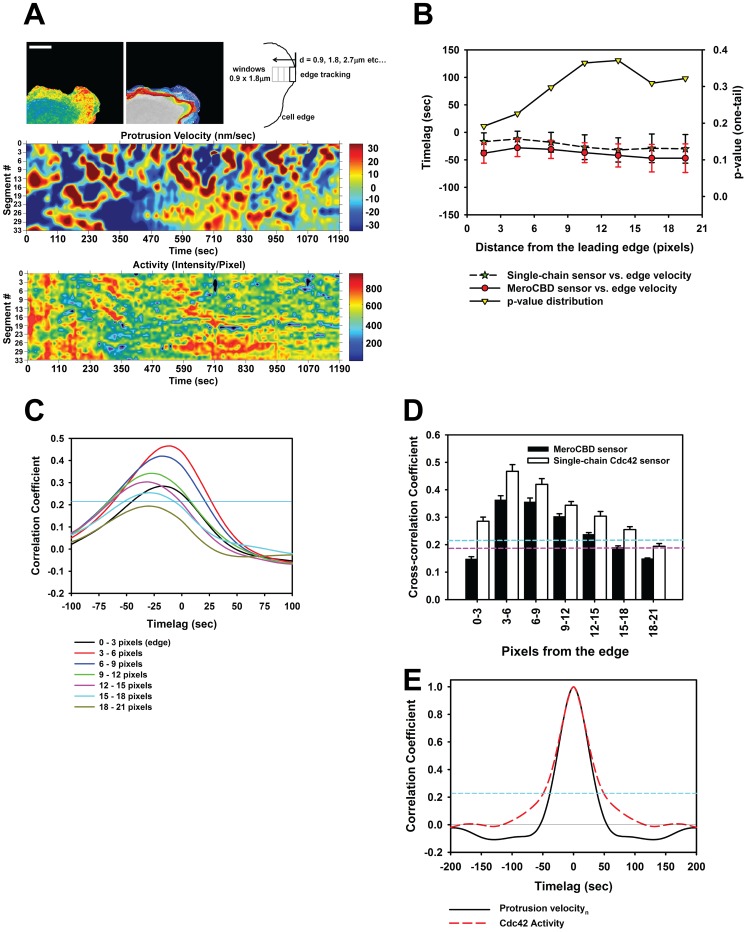
Figure 3. Morphodynamics analysis comparing the new Cdc42 biosensor to MeroCBD.
A) A representative edge segment is shown together with the temporal evolution of the edge location and the sampling window construction scheme. Below, the morphodynamics mapping of the edge velocities and the associated Cdc42 activation fluctuations are shown. B) The comparison of the cross-correlational timelags at different spatial locations are shown for the new Cdc42 biosensor and the MeroCBD, shown with SEM. P-values are also shown. MeroCBD: n = 8 cells: 414 windows; single-chain Cdc42 biosensor: n = 9 cells: 532 windows. C) The evolution of the timelags as a function of the spatial position away from the edge for the new single-chain biosensor. Region above the blue line indicates p<0.05. D) Comparison of the strength of the cross-correlation coupling between the edge velocity and the associated Cdc42 at different spatial location, shown for both MeroCBD and the new single-chain biosensor. The region above the dashed blue line indicates the p<0.05 for the single-chain sensor and the dashed purple line indicates that for the MeroCBD sensor. E) Autocorrelation functions for the normal-direction edge velocity and Cdc42 activity measured using the new single-chain biosensor. The region above the blue dashed line indicates p<0.05.

