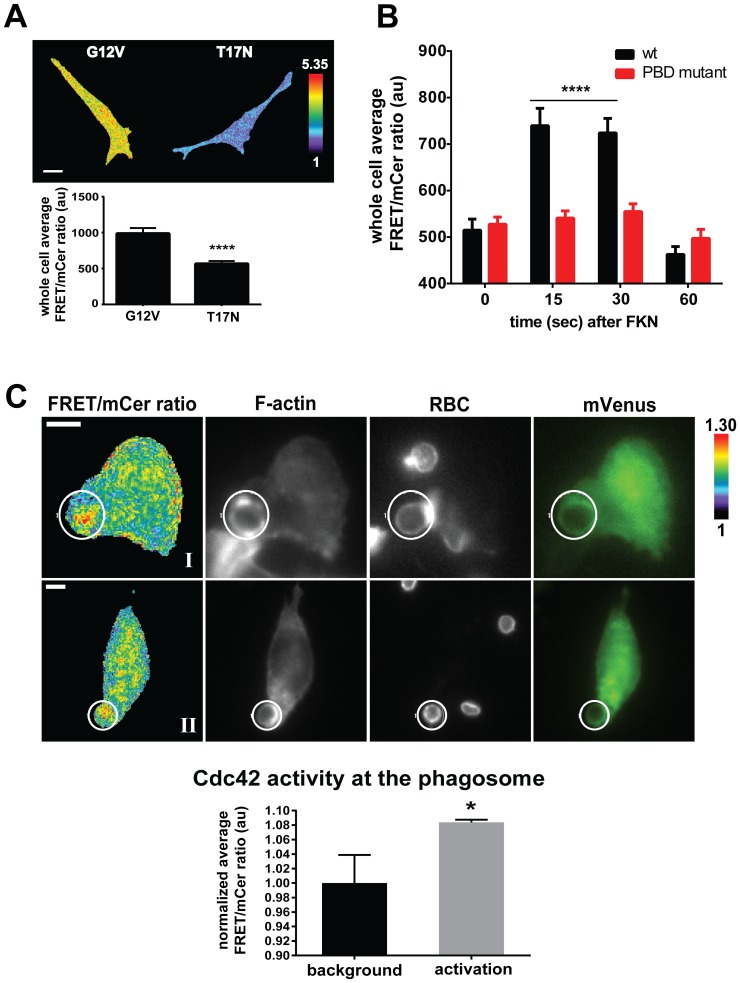
Figure 4. Cdc42 is activated during macrophage phagocytosis and CX3CL1 stimulation.
A) Whole cell average of FRET/mCer ratio analyzed in RAW/LR5 cells transiently expressing G12V or T17N mutant forms of the Cdc42 biosensor. Scale bar = 10 µm. n = 15 cells per condition with mean +/− SEM, **** p<0.0001. B) Quantitation of whole cell average of FRET/mCer ratio analyzed in RAW/LR5 cells transiently expressing wild-type or PBD mutant control of Cdc42 biosensor and stimulated with 50 ng/mL CX3CL1 for indicated times. Average raw values of 3 independent experiments and at least 15 cells per condition per experiment with SEM, **** p<0.0001 compared to wt at t = 0 time point. No significant changes were measured for the PBD mutant set. C) Representative ratiometric images of RAW/LR5 cells transiently expressing wild-type Cdc42 biosensor (Ratio), F-actin, Red blood cells (RBC) (grayscale panels), mVenus-biosensor localization (green panels). The white bar in the whole-cell frame corresponds to 10 µm. Quantitation of active levels of Cdc42 at the phagosome (designated by white circle) normalized to background levels are shown; n = 18 phagocytic events, values are mean +/− SEM, * p<0.0193. Further localization analysis of these representative cells are shown in Fig.S4.

