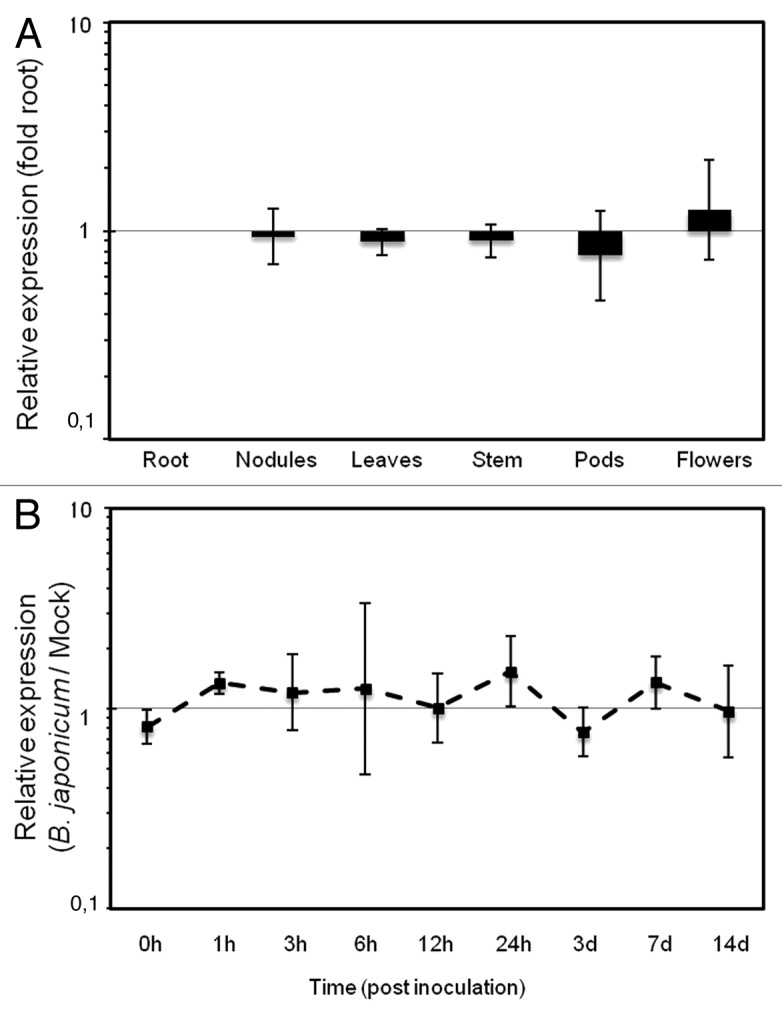
Figure 2. Expression of miR1515 in different soybean tissues (A) and along the course of nodulation (B) in soybean assayed by hairpin cDNA qPCR. (A) Relative expression compared with roots were calculated using average Ct values from four independent replicates (B) Relative expression at each time point post B. japonicum inoculation compared with mock inoculated roots. Data shown are average of four independent biological replicates. Error bars represent SD.
