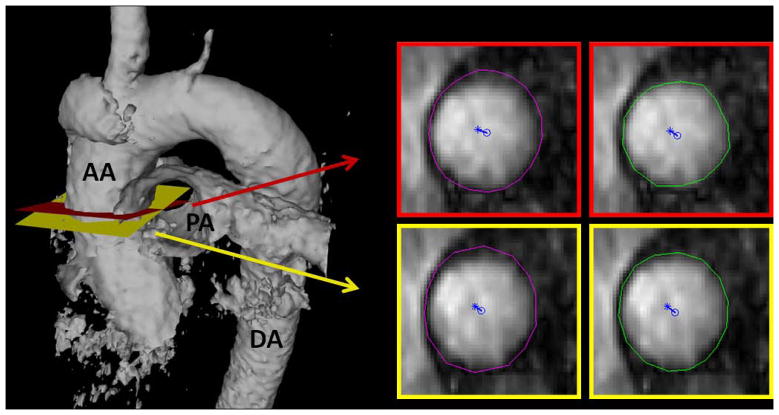
Figure 1.
Example case demonstrating how cross-sectional planes of data were exported and then segmented for quantitative analysis. An isosurface of the thoracic aorta is provided on the left to show the location of the planes selected independently by two observers (one in red, the other in yellow). Each plane was then independently segmented by two separate observers for quantification of MRI blood hemodynamic markers (one contour in purple, the other in green). Normalized flow displacement from the vessel center (blue circle) is depicted for each of the planes.

