
Figure 2.
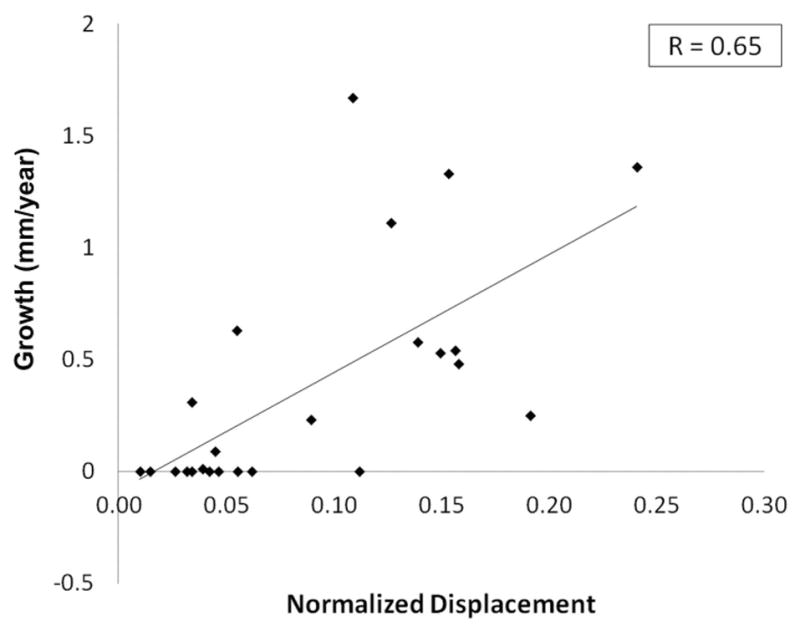
Plot of interval aortic growth versus normalized displacement. Note that the average of the 4 data points shown in Figure 1 was used for normalized displacement. A good correlation (r = 0.65, p < 0.001) was demonstrated, significantly higher than for any of the other MRI blood hemodynamic markers.