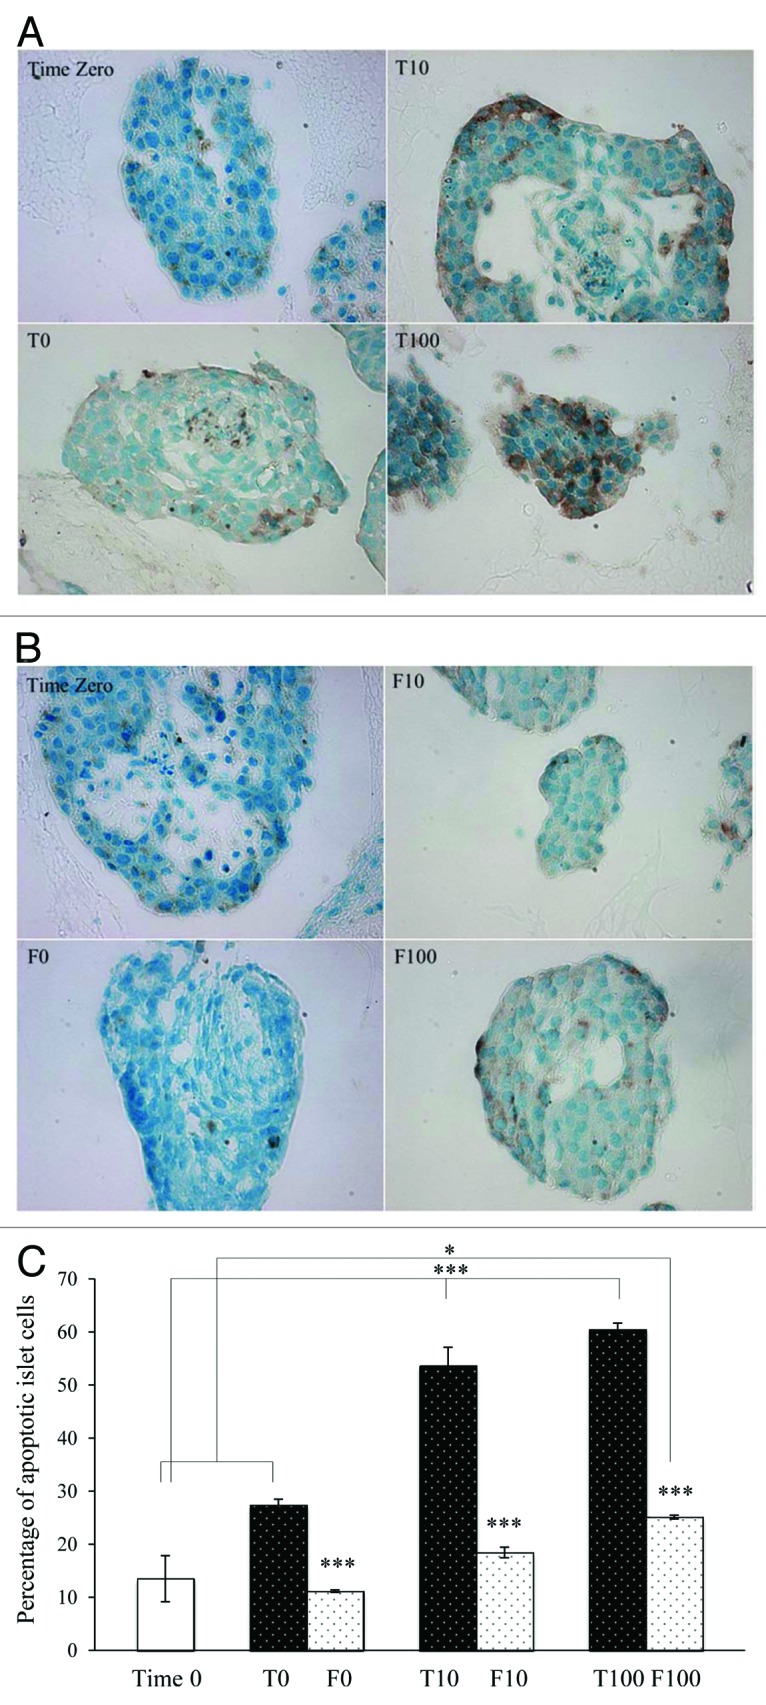
Figure 6. Light microscopy images of young porcine endocrine pancreatic islets treated with the APO-BrdU IHC staining kit. 40× magnification. Islets cultured in TCPS plates with 0, 10 or 100 µM H2O2 compared with Time Zero (A) and islets embedded in fibrin with 0, 10, or 100 µM H2O2 compared with Time Zero (B) are shown. The percentage of apoptotic cells (brown) in the total cell population (blue and brown) is shown in Figure 6C. ’*’ represents a value of P < 0.05, ‘***’ represents a value of P < 0.001. *** compared Time Zero with T10 and Time Zero with T100 and each T-set compared with the corresponding F-set.
