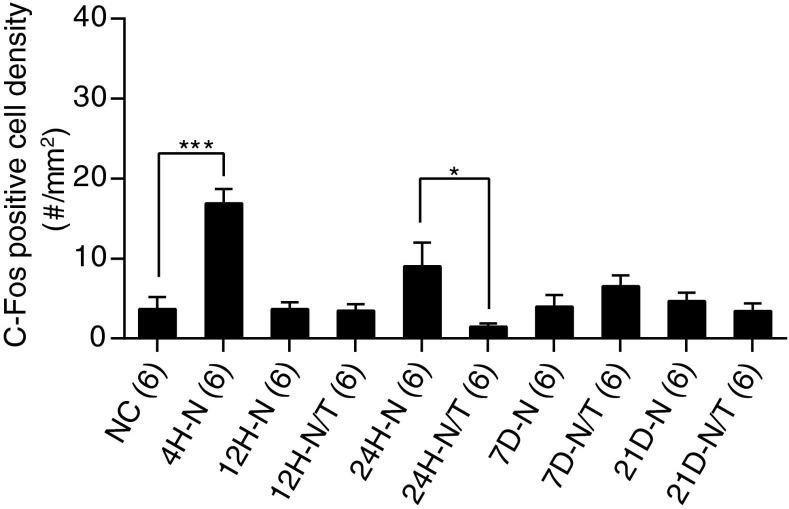
FIG. 14.
Effects of treatment on c-fos expression in the AVCN. The number of c-fos-positive cells in the AVCN was counted and statistically analyzed. Compared to normal controls, significantly more c-fos-positive cells were observed in the AVCN 4 h (H) after noise (N) exposure (p < 0.001, 1H-N). There was a significant reduction in the number of c-fos-positive cells in the treated (T) group compared to the non-untreated group at 24 h after noise exposure (24H-N/T vs. 24H-N, p < 0.05). No significant difference was observed at later time points by one-way ANOVA with Tukey post hoc test (all p > 0.05). *p < 0.05 and ***p < 0.001. Error bars represent standard error of the mean.

