
FIG. 9.
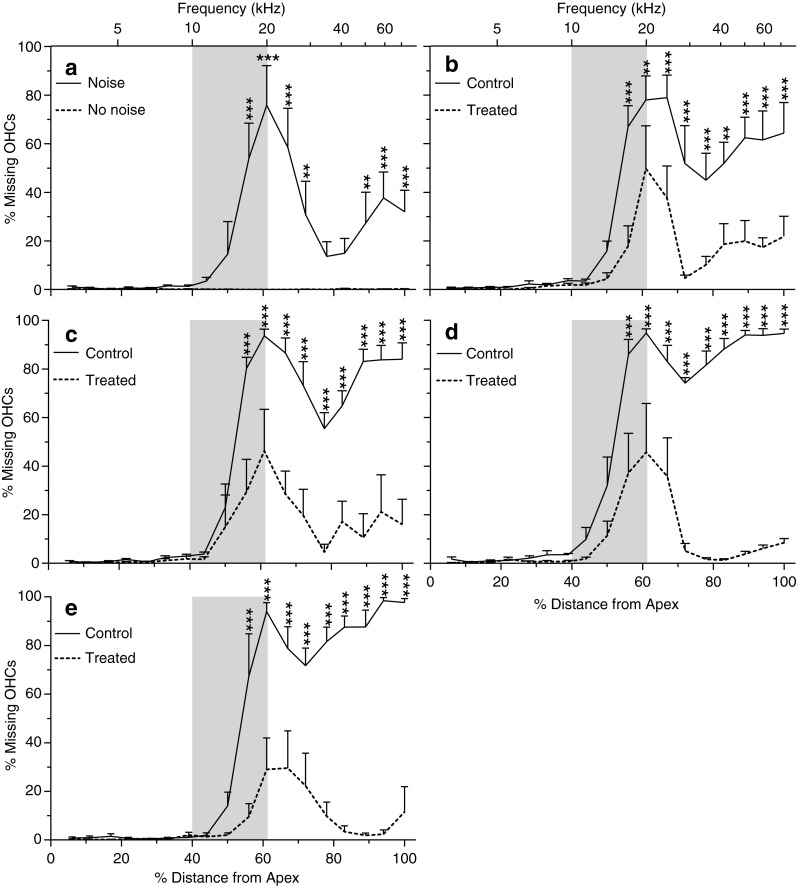
Percent OHC loss as a function of percent distance (frequency place in kiloHertz) from the OC apex in normal control (no noise, untreated) and at 4 h (A), 12 h (B), 24 h (C), 7 days (D), and 21 days (E) after exposure to the 115-dB OBN in the noise only and treated groups. Shaded areas show the frequency range of the noise. The data are plotted as mean ± SEM. Six cochlea were analyzed for each data point. OHC loss was already seen in the middle to basal part of the cochlea at 4 h post-exposure and progressively increased, especially in the basal part of the cochlea, in the untreated noise-exposed group, while OHC loss remained at a low level in the treated group over the 21 days after noise exposure. Data analysis was performed by two-way ANOVA followed by Bonferroni post-tests: *p <0.05; **p < 0.01; ***p < 0.001.