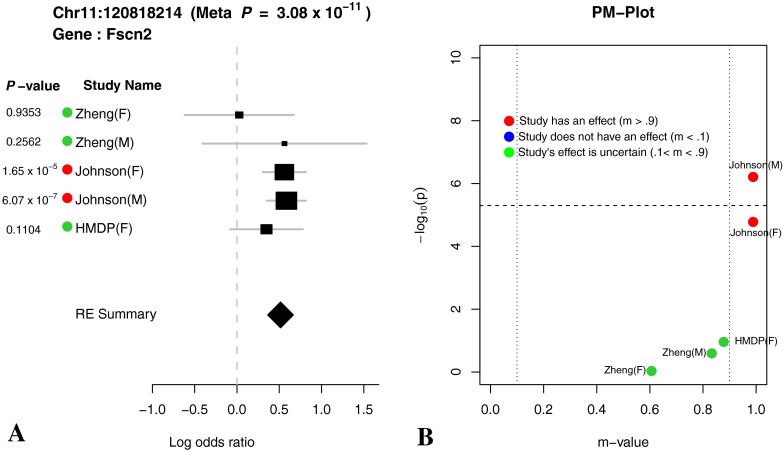
FIG. 6.
(A) Forest plot and (B) PM plot for Chr11:120818214 locus (8 kHz). The Forest plot and PM plot shows the effect size estimates and m value from each study. The black square represents the effect size estimate and the size of the square represents the weights given to each study. The width of line in each study represents the confidence interval (CI) for effect size estimate. The diamond located at the bottom of the Forest plot shows the overall effect size estimate and the width of the diamond shows the confidence intervals for the overall effect estimate. The m value of the study represents the posterior probability that the effect of this locus exists for the phenotype. The horizontal dotted line in the PM plot denotes the genome-wide significance threshold (5.0 × 10⁻⁶). The two vertical dotted lines in the PM plot denote the posterior probability threshold for m value (0.1 and 0.9). The color dots for each study in the Forest plot and PM plot shows the posterior probability that a genetic effect exists for the study. Meta P denotes the P value obtained by the random effect meta-analysis.

