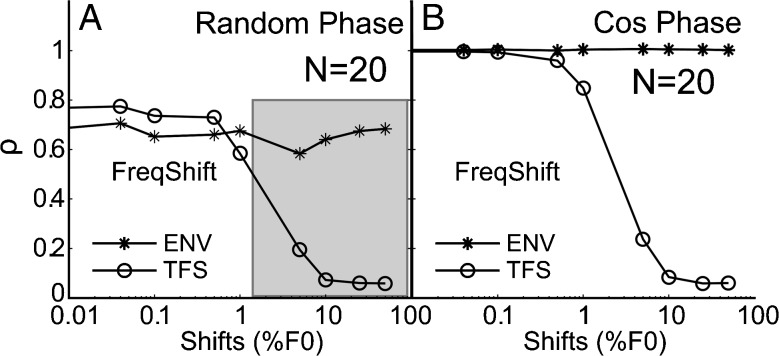
FIG. 11.
Harmonic and inharmonic tone complexes can be discriminated based on TFS cues. ρ ENV (asterisks) and ρ TFS (circles) from AN model responses are shown as functions of ΔF (in % of F0) for random-phase conditions (A) and cosine-phase conditions (B). Harmonic rank (N) was 20. Each data point is a mean of 40 realizations. Each realization used a separate set of random phases. Shaded region in A shows the range of shifts in F0 over which TFS could possibly be a cue with randomized phase since ρ TFS monotonically decreases with frequency shift, whereas the differences in the envelope are independent of frequency shift.

