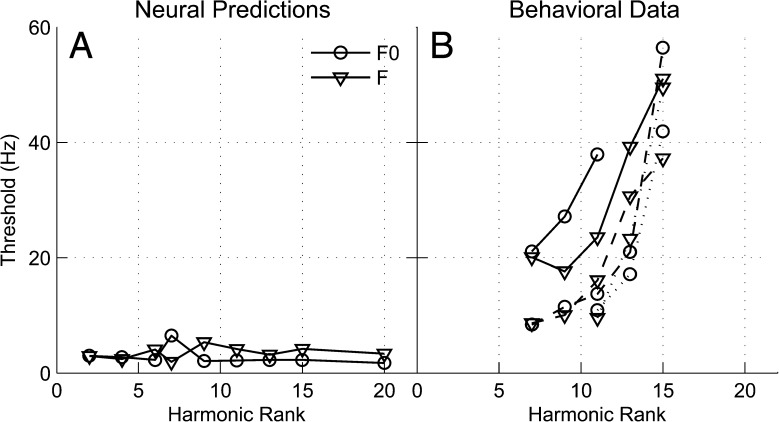
FIG. 12.
A Neural thresholds in hertz for F0- and frequency-discrimination tasks predicted from the ρ TFS metric. Thresholds were defined as the shift in hertz at which ρ TFS dropped to a fixed criterion value (see text). Symbols indicate different shift paradigms. The data were obtained from a model AN fiber with a CF of 1,170 Hz, which matches the CF of the fiber shown in Figures 4 and 5. F0 varied with harmonic rank. B Thresholds for F0 and frequency discrimination of three-component complexes obtained from a perceptual study (Moore et. al. 2009), expressed in terms of the frequency shift in hertz of the center component. Data are shown for different combinations of center harmonic number (N) and F0. Solid lines represent an F0 of 35 Hz, dashed lines represent an F0 of 50 Hz, and the dotted lines represent an F0 of 100 Hz. Center-harmonic numbers are indicated underneath the x-axis. The thresholds shown are for random-phase stimuli.

