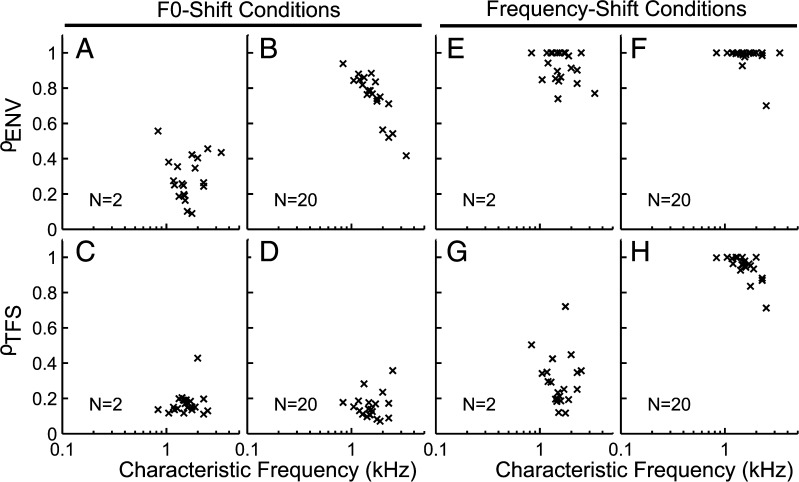
FIG. 13.
Envelope and TFS cues available for F0- and frequency-discrimination tasks were generally consistent across the AN-fiber population. ρ ENV (top row) and ρ TFS (bottom row) for individual AN fibers are plotted as a function of characteristic frequency. A–D F0-shift conditions. E–H Frequency-shift conditions. All results are for cosine-phase conditions with a shift corresponding to 0.5 % of F0.

