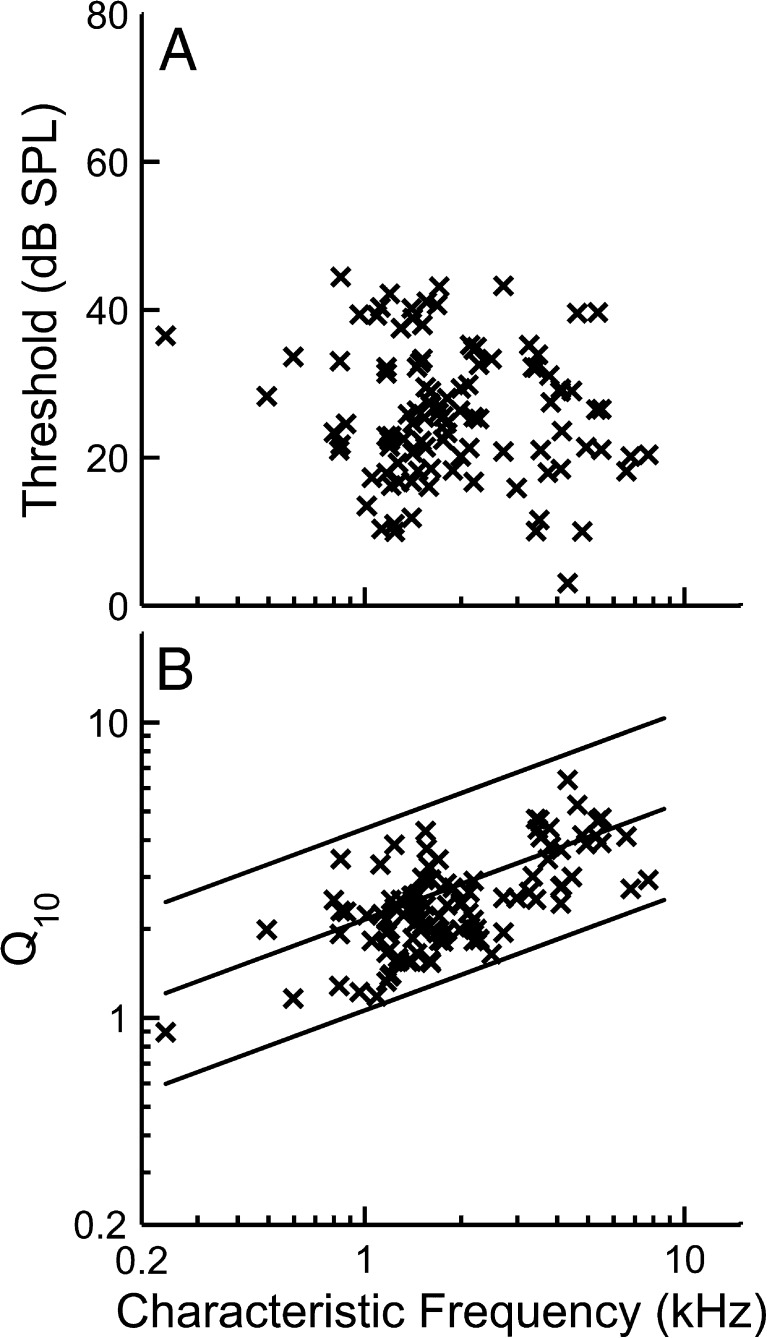
FIG. 2.
Tuning-curve characteristics as a function of characteristic frequency (CF). A Fiber thresholds at CF. B Tuning-curve sharpness as represented by Q 10 (ratio of CF to bandwidth 10 dB above threshold). Solid lines represent the 5th, 50th, and 95th percentiles of a large normal-hearing population (Kale and Heinz 2010).

