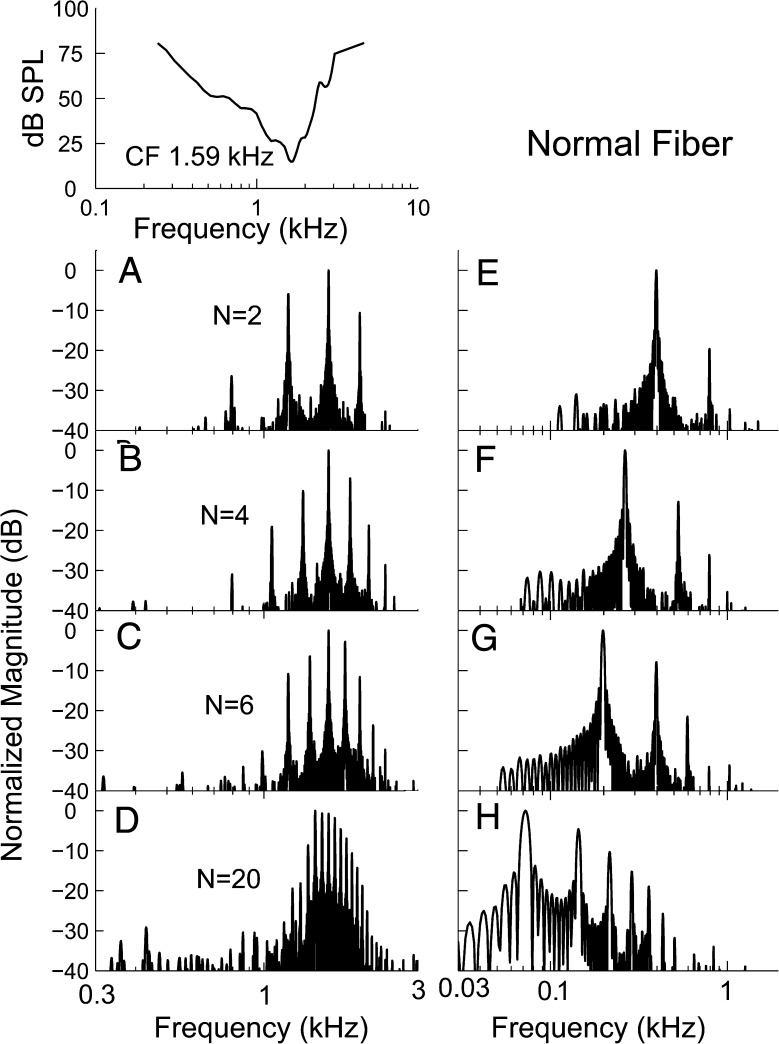
FIG. 3.
The most dominant TFS response component was near CF. A–D Normalized power spectra of difcor functions, representing the TFS response. E, F Normalized power spectra for sumcor functions, representing the ENV response. Each row represents a rank condition (N) shown in the middle of each of the panels A–D. The tuning curve for the fiber is shown above panel A.

