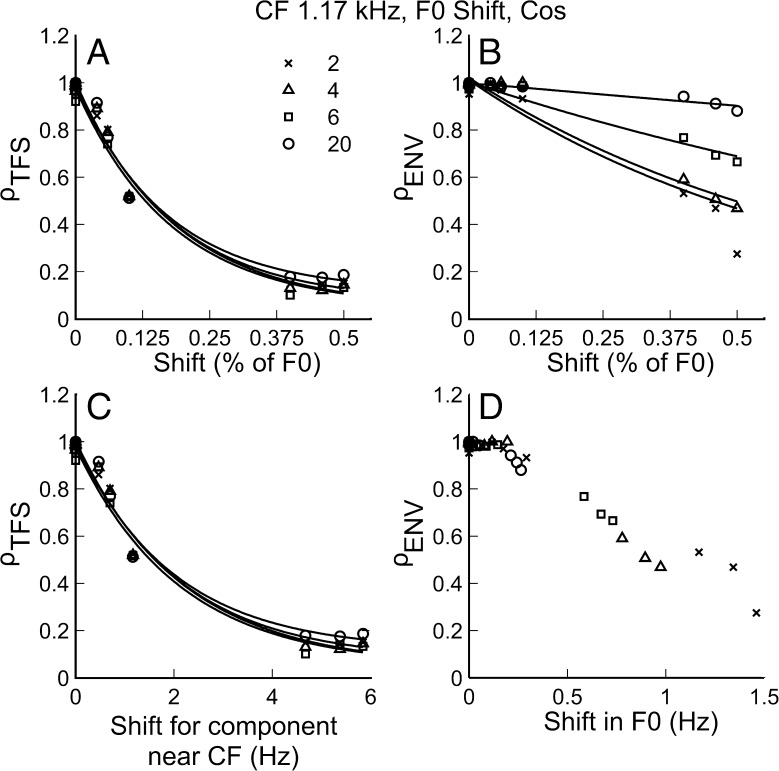
FIG. 4.
Both envelope and TFS cues were available for F0 discrimination. A ρ TFS as a function of ΔF0 in percent of F0 (same as % of CF). C ρ TFS as a function of shift in hertz for a component near the CF of the fiber. B ρ ENV as a function of ΔF0 (in % of F0) and D ρ ENV as a function of ΔF0 in hertz. Different harmonic rank conditions are indicated by different symbols. Data in panels A, B, and C are fitted with two-term exponential functions just to emphasize general trends.

