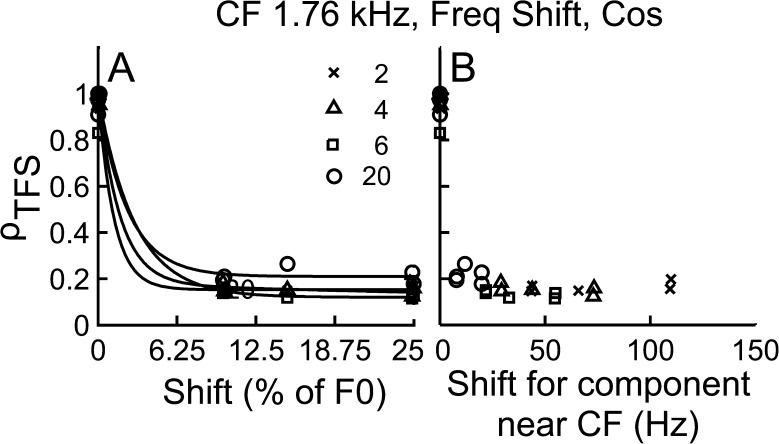
FIG. 7.
TFS cues were available for the discrimination of harmonic and inharmonic stimuli even for “unresolved” conditions. Data shown are similar to Figure 6, but over a much wider range of frequency shifts and for a different AN fiber. A ρ TFS as a function ΔF (in % of F0). B ρ TFS as a function of shift for a component near CF (in Hz).

