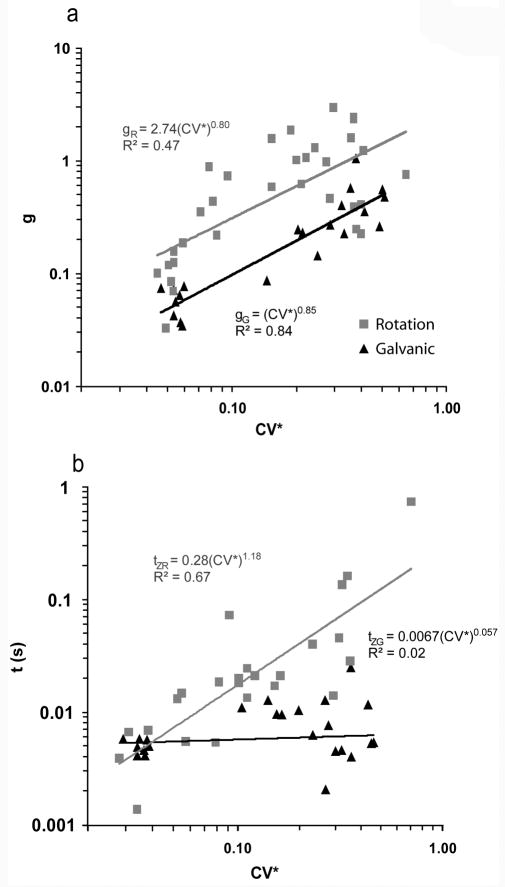
Figure 1.
Sensitivity (g, panel a) and the time constant (tz, panel b) of the transfer function g·(tzs + 1) are plotted versus CV*for each afferent. The mid-band galvanic sensitivity (gG) shows a logarithmic increase with CV* (gG = (CV*)0.87) (r2 = 0.80) whereas the mid-band rotational sensitivity (gR) is flat with respect to CV* (gR = 0.49·(CV*)0.05) (r2 = 0.002) (a). However, the rotational 1st order lead term (tRz) shows a logarithmic increase with CV* (tRz = 0.28· (CV*)1.18) (r2 = 0.67), whereas the galvanic 1st order lead term (tGz) is relatively flat with respect to CV* (tGz = 0.04· (CV*)0.06) (r2 = 0.01) (b). Fits were made by including all afferent types (Regular, Dimorphic, and Calyx-only). To minimize variation across animals galvanic sensitivities were normalized such that when CV* = 1, gG = 1.

