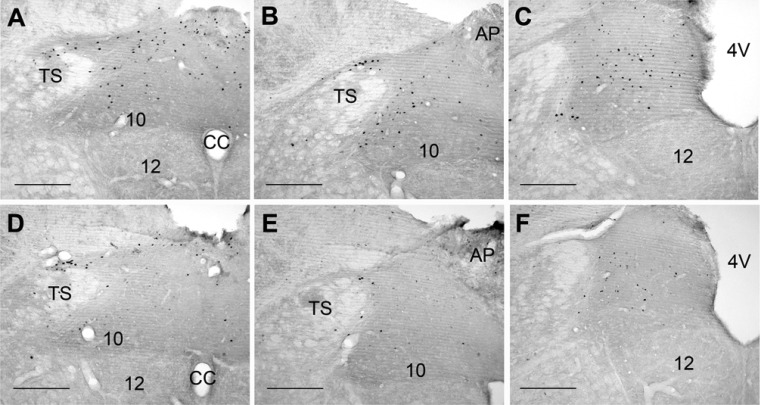
Fig. 7.
Representative photomicrographs of c-Fos expression in the NTS of an adult lean rat (A–C) and an adult obese rat (D–F) after 90 min of a PE-induced increase in MAP. Photos are from 3 rostrocaudal levels in relation to bregma: −14.2 mm (A and C), −13.8 mm (B and E), and −13.4 mm (C and F). AP, area postrema; CC, central canal; TS, tractus solitarius, 4V, 4th ventricle; 10, dorsal motor nucleus of the vagus; 12, hypoglossal motor nucleus. Scale bars are 250 mm.

