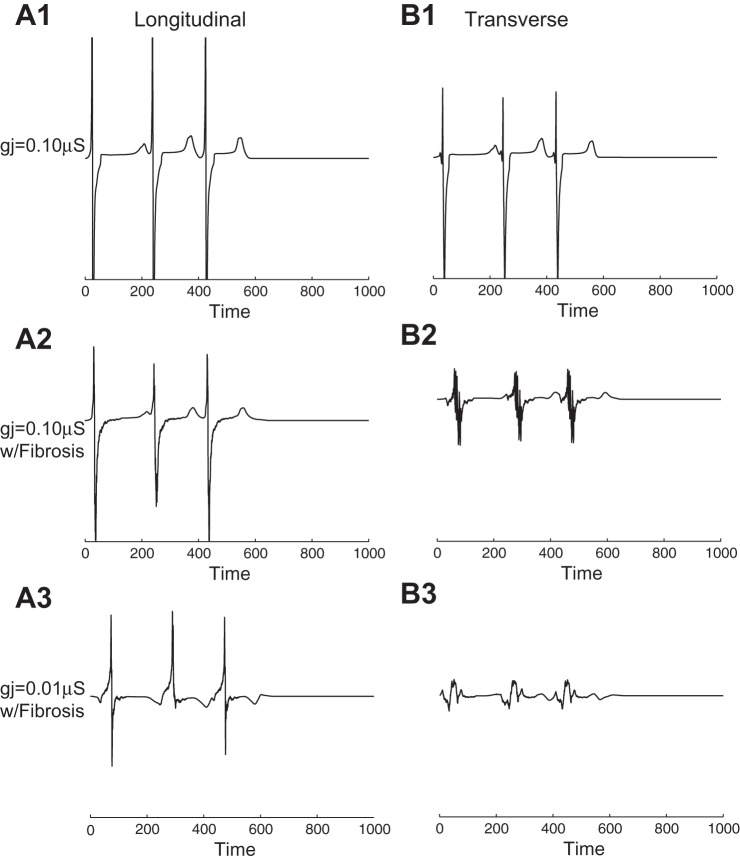
Fig. 9.
A: electrograms taken with 960-μm disk electrodes for wavefronts propagating along the longitudinal and transverse directions in control tissue with no fibrosis and gj(WC) = 0.10 μS. B: electrograms taken in the longitudinal and transverse directions in inhomogeneous tissue with fibrosis and gj(WC) = 0.10 μS. C: electrograms taken in the longitudinal and transverse directions in the central region of inhomogeneous tissue with fibrosis and gj(PC) = 0.01 μS. The position of the recording electrode is indicated by the black electrode in Fig. 1A.

