Fig. 1.
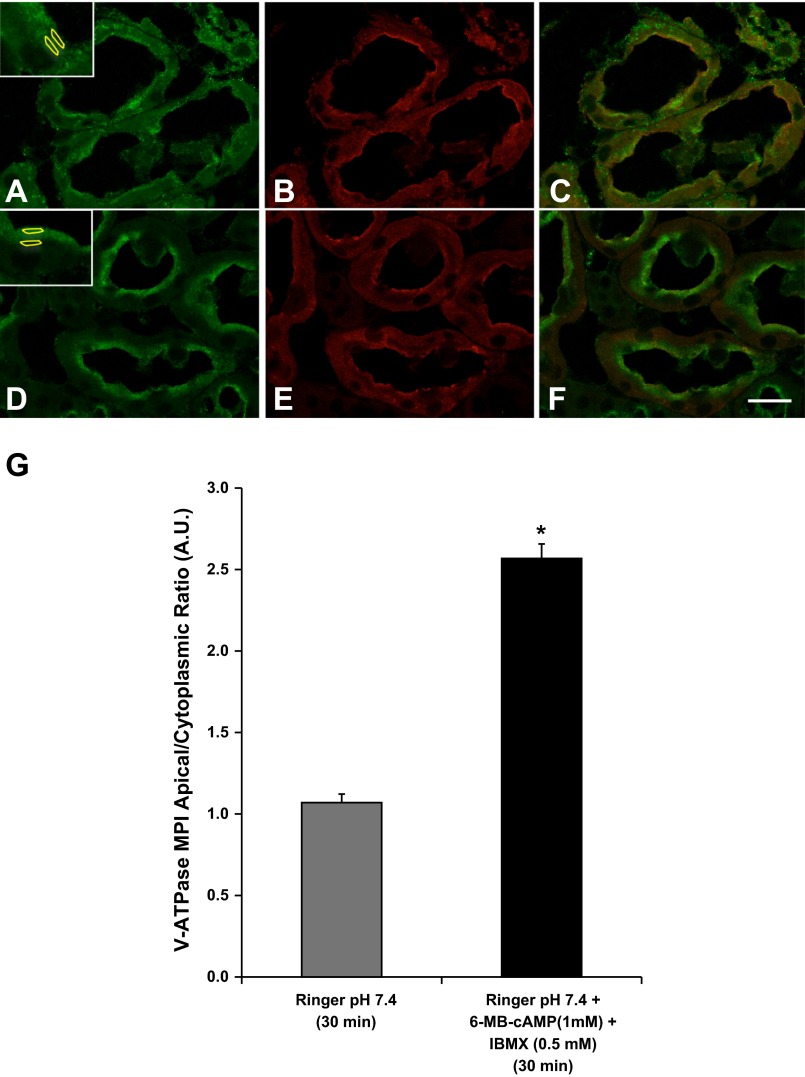
Protein kinase A (PKA) agonists induce apical membrane accumulation of the vacuolar H+-ATPase (V-ATPase) in the proximal tubule S3 segment in kidney slices. A: the V-ATPase displays a cytoplasmic distribution in confocal images of kidney slices treated with Ringer buffer alone for 30 min and immunolabeled with an antibody against the E subunit (green) with partial colocalization with the brush-border marker Cy3-coupled WGA (B, red). C: WGA labeling is partially colocalizing with E subunit labeling. D: addition of the cell-permeant N6-monobutyryl-cAMP (6-MB-cAMP) (1 mM) plus IBMX (0.5 mM) induced an apical/luminal accumulation of the V-ATPase. E: these kidney slices were also colabeled with CY3-coupled WGA, which did not show a significant change in distribution in the presence of the PKA agonist. F: in the merged image the E subunit immunolabeling becomes dominant to the WGA labeling at the apical pole of the S3 segment epithelial cells in the presence of the PKA activating compounds. Regions of interest (ROIs) were outlined for each cell at apical and cytoplasmic regions for quantification using previously described method (2, 4, 5) as illustrated in A and D, insets. G: quantification of the mean (±SE) of V-ATPase E subunit-associated mean pixel intensity (MPI) apical-to-cytoplasmic ratio [arbitrary units (AU)] was used as a measure of apical V-ATPase accumulation, which was greater in the presence of PKA agonists. Data were obtained from at least 3 separate experiments measuring a total of at least 30 cells per condition (*P < 0.05 vs. Ringer, pH 7.4, 30 min). Scale bar = 20 μm.

