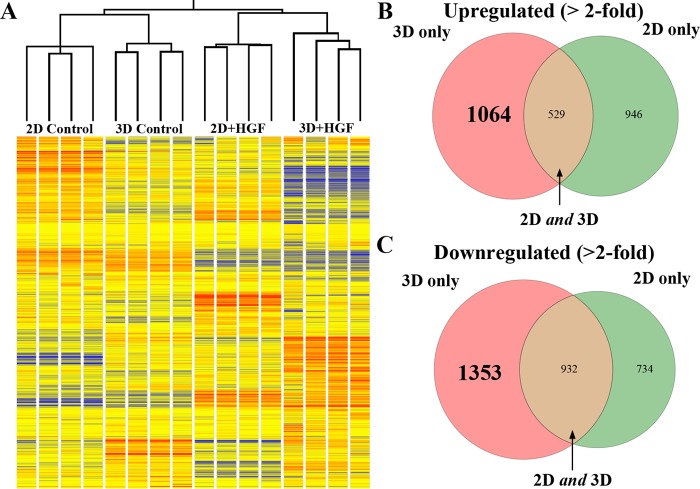
Fig. 1.
Differential gene expression observed between 2- and 3-dimensional (2D and 3D)-cultured Madin-Darby canine kidney (MDCK) cells, as assessed by microarray analysis. A: hierarchical clustering of samples using Pearson correlation with average linkage. Dendrogram and heat map show replicate group similarity and distinguishable and reproducible gene-expression patterns between treatments. Gene-expression levels are relative to the median across all samples (red, above median; blue, below median; yellow, median). B: Venn diagram of genes upregulated in 2D and 3D after hepatocyte growth factor (HGF) treatment. There are 1,064 genes upregulated exclusively in 3D (pink), 529 genes upregulated in 2D and 3D (brown), and 946 genes upregulated only in 2D (green). C: Venn diagram of genes downregulated in 2D and 3D after HGF treatment. There are 1,353 genes downregulated only in 3D (pink), 932 genes downregulated in 2D and 3D (brown), and 734 genes downregulated only in 2D (green).

